Introduction: Why Most Traders Fail at Reading Candlestick Patterns
Let me ask you something: Have you ever placed a trade based on what looked like a perfect candlestick pattern, only to watch the market reverse and wipe out your account? You’re not alone. According to various industry reports, approximately 95% of retail traders lose money in the forex market, and a significant portion of these losses stem from misinterpreting or completely ignoring critical candlestick chart patterns.

Here’s the uncomfortable truth: The candlestick patterns you learned in your first trading course are probably not enough. Most educational resources teach you the basics, the hammer, the doji, the engulfing pattern, but they rarely show you how to use these patterns in the context of real market conditions. Even worse, they don’t teach you about the powerful candlestick setups that professional traders use daily to extract consistent profits from the market.
I’ve spent over a decade analyzing thousands of charts, placing countless trades, and yes, losing money on patterns I thought I understood. Through this journey, I’ve discovered that the difference between profitable traders and those who blow their accounts isn’t intelligence or access to better tools. It’s about knowing which candlestick patterns actually work, understanding the psychology behind them, and having the discipline to wait for the right setups.
In this comprehensive guide, I’m going to share with you 12 powerful candlestick patterns that most losing traders either don’t know about or consistently ignore. These aren’t just theoretical concepts, these are battle-tested formations that have made the difference between profit and loss in my own trading journey. By the end of this post, you’ll understand not only how to identify these patterns but also how to trade them successfully with proper risk management and emotional discipline.
The clock is ticking on your trading career. Every day you ignore these patterns is another day you’re leaving money on the table while professional traders capitalize on opportunities you can’t even see. Let’s change that right now.
Understanding Candlestick Patterns: The Foundation Every Trader Needs
Before we dive into the 12 powerful setups, let’s establish a solid foundation. Candlestick patterns are visual representations of price action over a specific time period. Each candlestick tells a story about the battle between buyers and sellers during that timeframe.
The Anatomy of a Candlestick
Every candlestick has four key components:
- The Open: Where the price started during that period
- The Close: Where the price ended during that period
- The High: The highest price reached during that period
- The Low: The lowest price reached during that period
The “body” of the candlestick represents the distance between the open and close, while the “wicks” (or shadows) show the high and low extremes. When the close is higher than the open, we typically see a green or white candle (bullish). When the close is lower than the open, we see a red or black candle (bearish).
Why Candlestick Patterns Work: The Psychology Behind the Price Action
Here’s something most trading courses won’t tell you: Candlestick patterns work because they represent human psychology at scale. Every candle reflects the collective emotions of thousands or millions of traders, their fear, greed, uncertainty, and conviction.
When you see a long bullish candle, you’re witnessing a period where buyers overwhelmed sellers with such force that the price moved significantly upward. When you see a doji (where open and close are nearly identical), you’re observing indecision—a moment where neither bulls nor bears could gain control.
Understanding this psychology is crucial because it helps you anticipate what might happen next. Professional traders don’t just memorize pattern shapes; they understand the emotional story each pattern tells and use that insight to predict future price movement.
The Critical Mistake: Pattern Recognition Without Context
This is where 95% of traders go wrong. They spot a bullish engulfing pattern and immediately buy, without considering:
- Where in the trend cycle are we?
- What’s the overall market structure?
- Is there volume confirmation?
- Are we at a key support or resistance level?
- What’s the risk-to-reward ratio on this setup?
Trading candlestick patterns successfully requires understanding context. A hammer candlestick at the bottom of a downtrend after a significant selloff is powerful. The same hammer in the middle of choppy, directionless price action is essentially meaningless.
This contextual awareness separates profitable traders from those who constantly wonder why their “perfect” setups keep failing.
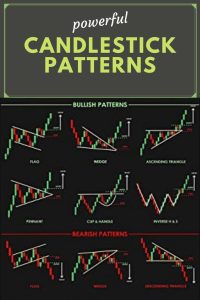
The 12 Powerful Candlestick Patterns 95% of Traders Ignore
Now let’s get to the meat of this article. These 12 candlestick patterns represent some of the most reliable setups in forex trading, yet most traders either don’t know about them or fail to recognize them in real-time market conditions.
1. The Three White Soldiers: The Unstoppable Bullish Force
The Three White Soldiers pattern is one of the most powerful bullish reversal patterns you can find, yet it’s criminally underutilized by retail traders.
What It Looks Like: This pattern consists of three consecutive long-bodied bullish candles, each opening within or near the previous candle’s body and closing progressively higher. The candles should have small or no upper wicks, indicating that buyers maintained control throughout each session.
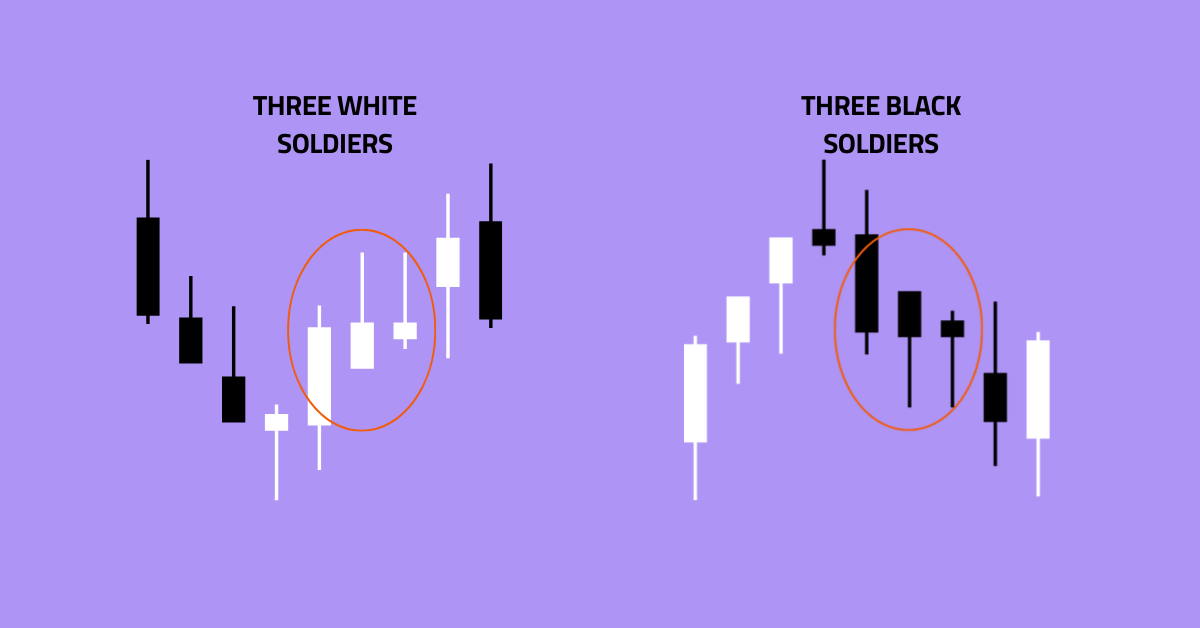
The Psychology Behind It: This pattern signals a dramatic shift in market sentiment. After a downtrend or period of consolidation, buyers enter the market with such overwhelming force that they push prices higher for three consecutive sessions. Each candle represents renewed buying pressure, and the lack of significant upper wicks shows that sellers couldn’t even mount a meaningful counter-attack.
How to Trade It Successfully:
- Confirmation is key: Wait for all three candles to complete before entering
- Volume matters: Look for increasing volume on each successive candle
- Entry point: Enter on the close of the third white soldier or on a pullback to the top of the first candle (now acting as support)
- Stop loss: Place your stop below the low of the first candle in the pattern
- Take profit: Target previous resistance levels or use a 2:1 or 3:1 risk-to-reward ratio
Common Mistakes to Avoid:
- Entering too early after only two candles
- Ignoring this pattern when it appears near major resistance
- Trading it without volume confirmation
- Not waiting for a proper pullback entry, leading to poor risk-to-reward setups
2. The Three Black Crows: The Bearish Massacre Pattern
The evil twin of the Three White Soldiers, the Three Black Crows pattern signals a powerful bearish reversal that can decimate long positions.
What It Looks Like: Three consecutive long-bodied bearish candles, each opening within or near the previous candle’s body and closing progressively lower. The candles should have small or no lower wicks.

The Psychology Behind It: This pattern often appears after an extended uptrend or at major resistance levels. It represents capitulation—when bulls give up and bears take complete control. The three consecutive down days show relentless selling pressure with buyers unable to defend any price level.
Trading Strategy:
- Entry: After the third black crow closes, or on a bounce to the bottom of the first candle
- Stop loss: Above the high of the first bearish candle
- Target: Previous support levels or measured moves based on the pattern height
- Best timeframes: Daily and 4-hour charts for most reliable signals
Pro Tip: The Three Black Crows pattern is particularly powerful when it appears after a false breakout above resistance. This combination traps late buyers and triggers a cascade of stop-losses, creating explosive downward movement.
3. The Morning Star: The Dawn of a New Trend
The Morning Star is a three-candle reversal pattern that signals the end of a downtrend and the beginning of an uptrend. Despite its reliability, many traders miss it because they’re too focused on simpler single-candle patterns.

Pattern Structure:
- First candle: A long bearish candle continuing the downtrend
- Second candle: A small-bodied candle (can be bullish or bearish) that gaps down, showing indecision
- Third candle: A long bullish candle that closes well into the body of the first candle
Why It’s Powerful: The Morning Star tells a complete story. The first candle shows bears in control. The second candle (the “star”) reveals that sellers are losing momentum, they can’t push prices significantly lower. The third candle confirms that bulls have seized control and are driving prices back up.
Optimal Trading Approach:
- Best location: After a clear downtrend, preferably at a support level
- Entry timing: On the close of the third candle or on a retest of the pattern low
- Stop loss: 10-20 pips below the low of the middle candle
- Confirmation: Look for the third candle to close above the 50% level of the first candle’s body
- Volume: Ideally, you want to see increasing volume on the third candle
Real-World Application: I remember a EUR/USD trade in 2022 where a Morning Star formed at a major weekly support level near 0.9950. The pattern was textbook perfect—a long red candle, followed by a small indecision doji, then a powerful green candle that engulfed more than 70% of the first candle’s body. That single trade delivered a 200-pip move over the following week.
4. The Evening Star: When the Party’s Over
The Evening Star is the bearish counterpart to the Morning Star, and it’s equally powerful at signaling trend reversals.
Pattern Components:
- First candle: Long bullish candle continuing the uptrend
- Second candle: Small-bodied candle that gaps up (the evening “star”)
- Third candle: Long bearish candle that closes well into the first candle’s body
The Warning Signs: What makes the Evening Star particularly valuable is that it gives you a two-candle warning before the reversal completes. When you see that first strong bullish candle followed by a small indecision candle that gaps up, you should immediately start preparing for a potential reversal. This advance warning allows you to exit longs or prepare short positions before the crowd realizes what’s happening.
Advanced Trading Techniques:
- Partial profit strategy: If you’re in a long position when an Evening Star begins forming, take partial profits after the second candle and tighten your stop
- Scale-in approach: Enter a small short position after the third candle closes, then add to it on any bounce to the pattern high
- False breakout combination: Evening Stars are devastating when they form right after a new high, trapping breakout traders
5. The Piercing Pattern: The Two-Candle Reversal Most Traders Miss
The Piercing Pattern is a simple two-candle bullish reversal pattern, but its simplicity causes many traders to overlook its power.
Pattern Formation:
- First candle: A long bearish candle in a downtrend
- Second candle: Opens below the first candle’s low (gap down) but closes above the midpoint of the first candle’s body
Why Traders Miss It: Most trading education focuses on more exotic patterns, causing traders to ignore this straightforward but effective setup. Additionally, many traders don’t wait for the second candle to close above the 50% mark of the first candle—they either enter too early or not at all.
Proper Execution:
- The 50% rule is sacred: The second candle MUST close above the midpoint of the first candle’s body. If it closes below this level, the pattern is weak and unreliable
- Gap down is crucial: The second candle should open with a gap below the first candle’s low. This gap represents panic selling that gets immediately rejected by buyers
- Volume confirmation: Look for higher volume on the second candle compared to the first
- Best markets: Works exceptionally well in forex major pairs and liquid stocks
Trading Example: On a 4-hour GBP/USD chart, after a 150-pip decline, a Piercing Pattern forms at the 1.2500 psychological level. The first candle closes at 1.2485, and the second candle opens at 1.2470 (gapping down) but rallies to close at 1.2510—well above the 50% mark. Entry at 1.2510, stop at 1.2460, target at 1.2600 gives you a 2:1 risk-to-reward ratio.
6. The Dark Cloud Cover: The Ominous Reversal Signal
Dark Cloud Cover is the bearish equivalent of the Piercing Pattern and is equally overlooked by most traders.

Pattern Requirements:
- First candle: Long bullish candle in an uptrend
- Second candle: Opens above the first candle’s high (gap up) but closes below the midpoint of the first candle’s body
The Psychological Warfare: This pattern is psychologically devastating for late bulls. They see the gap up and think the rally is continuing, possibly even adding to their positions. Then the candle reverses sharply and closes deep into the previous candle’s body, trapping all those late buyers and triggering stops.
Optimal Trading Conditions:
- Resistance confluence: Most powerful when it forms at previous resistance levels
- Overextended conditions: Look for RSI above 70 or price far from moving averages
- After news events: Dark Cloud Cover patterns after positive news that gaps price up but then fails are especially reliable
- The deeper, the better: The further the second candle closes into the first candle’s body, the more bearish the signal
7. The Tweezer Tops and Bottoms: The Precision Reversal Patterns
Tweezer patterns are subtle but incredibly accurate when they appear at key levels. Yet most traders completely ignore them because they’re looking for more “exciting” setups.
Tweezer Bottom (Bullish): Two or more candles in a downtrend that make identical or nearly identical lows. The pattern shows that price tested a specific level multiple times and buyers defended it aggressively.

Tweezer Top (Bearish): Two or more candles in an uptrend that make identical or nearly identical highs. This demonstrates that sellers are actively defending a price level.
Why These Patterns Are Gold:
The beauty of tweezer patterns lies in their precision. They identify exact price levels where the balance of power is shifting. When you see a tweezer bottom at 1.2500 in EUR/USD, you now know that 1.2500 is a significant level where buyers are positioned, information you can use for future trades as well.
Trading Methodology:
- Entry: On the close of the second candle (or third if it’s a triple tweezer)
- Stop loss: Just beyond the tweezer lows (for bottoms) or highs (for tops)—usually 10-15 pips
- Tight risk: One of the best aspects of tweezer patterns is that they offer very tight, well-defined stop losses
- Confirmation: Wait for the candle after the tweezer to move in your favor before entering
- Multiple timeframe analysis: Tweezers on daily charts are more significant than those on 15-minute charts
Case Study: I once traded a tweezer bottom on USD/JPY at the 110.00 level. Three consecutive daily candles made lows at 109.98, 109.99, and 110.01—essentially identical. This showed institutional buyers were defending the 110.00 psychological level. I entered long at 110.25 after the third candle closed, with a stop at 109.75 (50 pips). The pair rallied to 112.50 over the next two weeks—a 225-pip winner from a 50-pip risk.
8. The Harami Pattern: The Inside Story of Market Reversal
The Harami pattern (meaning “pregnant” in Japanese) is a two-candle formation where the second candle is completely contained within the first candle’s body. Despite being taught in most courses, traders often ignore it because it seems too simple or requires patience.

Bullish Harami:
- First candle: Long bearish candle in a downtrend
- Second candle: Smaller bullish candle completely within the first candle’s body
Bearish Harami:
- First candle: Long bullish candle in an uptrend
- Second candle: Smaller bearish candle completely within the first candle’s body
The Psychology of Hesitation: The Harami pattern represents a pause in the trend—a moment of hesitation before a potential reversal. The large first candle shows strong directional movement, but the small second candle indicates that momentum is waning. The market is catching its breath, and often this pause precedes a reversal.
Why Most Traders Fail with Harami Patterns:
Most traders see a Harami and immediately enter a position, then get frustrated when the pattern fails. Here’s the secret: A Harami pattern alone is not enough. You need confirmation.
Proper Harami Trading Strategy:
- Wait for confirmation: Don’t trade the Harami itself, wait for the candle AFTER the Harami to break in the reversal direction
- Look for volume: The first candle should have high volume; the second candle should have declining volume
- Location matters: Harami patterns at major support/resistance are 10x more reliable than those in the middle of nowhere
- Combine with indicators: Use RSI or MACD divergence as additional confirmation
- Be patient: Harami patterns can take several candles to play out fully
Advanced Technique—The Harami Cross: When the second candle in a Harami is a doji (cross), it’s called a Harami Cross and is even more powerful. This shows extreme indecision and often precedes violent reversals.
9. The Bullish and Bearish Engulfing Patterns: The Power Play Reversals
Engulfing patterns are well-known, so you might wonder why they’re on this list of “ignored” patterns. The truth is, most traders know ABOUT engulfing patterns but still miss 80% of them in real-time or trade them incorrectly.
Bullish Engulfing: A small bearish candle followed by a large bullish candle that completely “engulfs” the previous candle’s body (opens lower than the previous close and closes higher than the previous open).
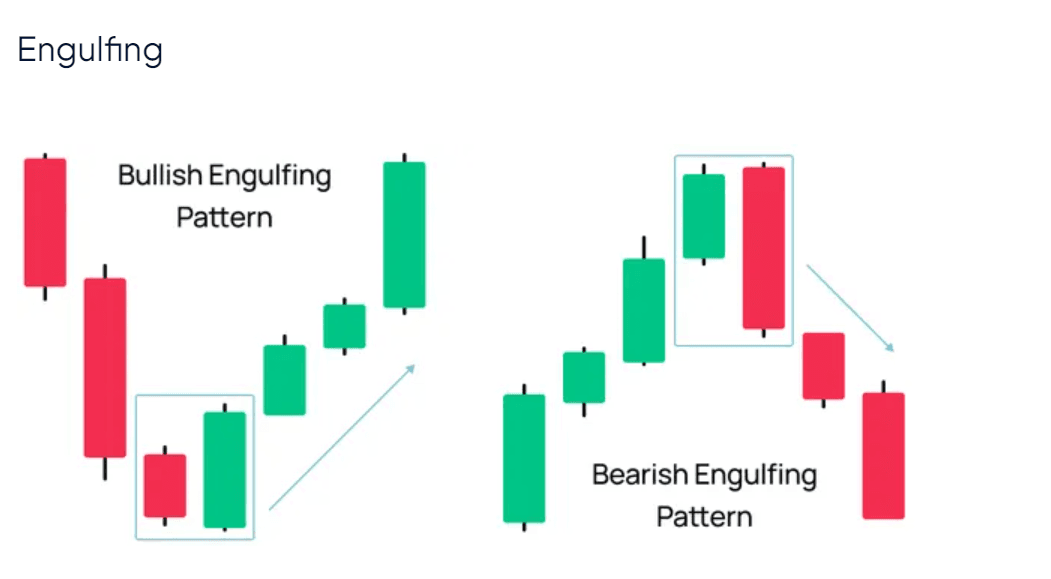
Bearish Engulfing: A small bullish candle followed by a large bearish candle that completely engulfs the previous candle’s body.
Why Traders Miss These “Obvious” Patterns:
- Timeframe blindness: They’re watching 5-minute charts and missing the daily engulfing patterns
- Size matters: They trade weak engulfing patterns where the second candle barely covers the first
- Impatience: They enter before the engulfing candle closes, then it fails to actually engulf
- Context ignorance: They trade engulfing patterns in consolidation instead of at trend extremes
The Professional Approach to Engulfing Patterns:
Size Ratio: The engulfing candle should be at least 1.5-2x the size of the previous candle. Weak engulfing patterns (where the second candle barely covers the first) have significantly lower success rates.
Volume Surge: The engulfing candle should show a notable increase in volume compared to recent candles. This confirms strong participation in the reversal.
Trend Context: Engulfing patterns work best when they appear after extended trends, not in the middle of ranging markets.
Rejection Wicks: An engulfing candle with a small wick in the direction of the engulfing (e.g., a bullish engulfing with a small lower wick) shows clean rejection of lower prices.
Trade Management for Engulfing Patterns:
- Entry: On the close of the engulfing candle or on a slight pullback
- Stop loss: Just beyond the high/low of the engulfing candle (add 5-10 pips buffer)
- First target: Previous support/resistance level
- Extended target: Use Fibonacci extension or measure the engulfing candle’s height and project it
10. The Shooting Star and Inverted Hammer: The Rejection Patterns Everyone Misreads
These single-candle patterns are among the most misunderstood in all of candlestick analysis, which is exactly why they belong on this list.
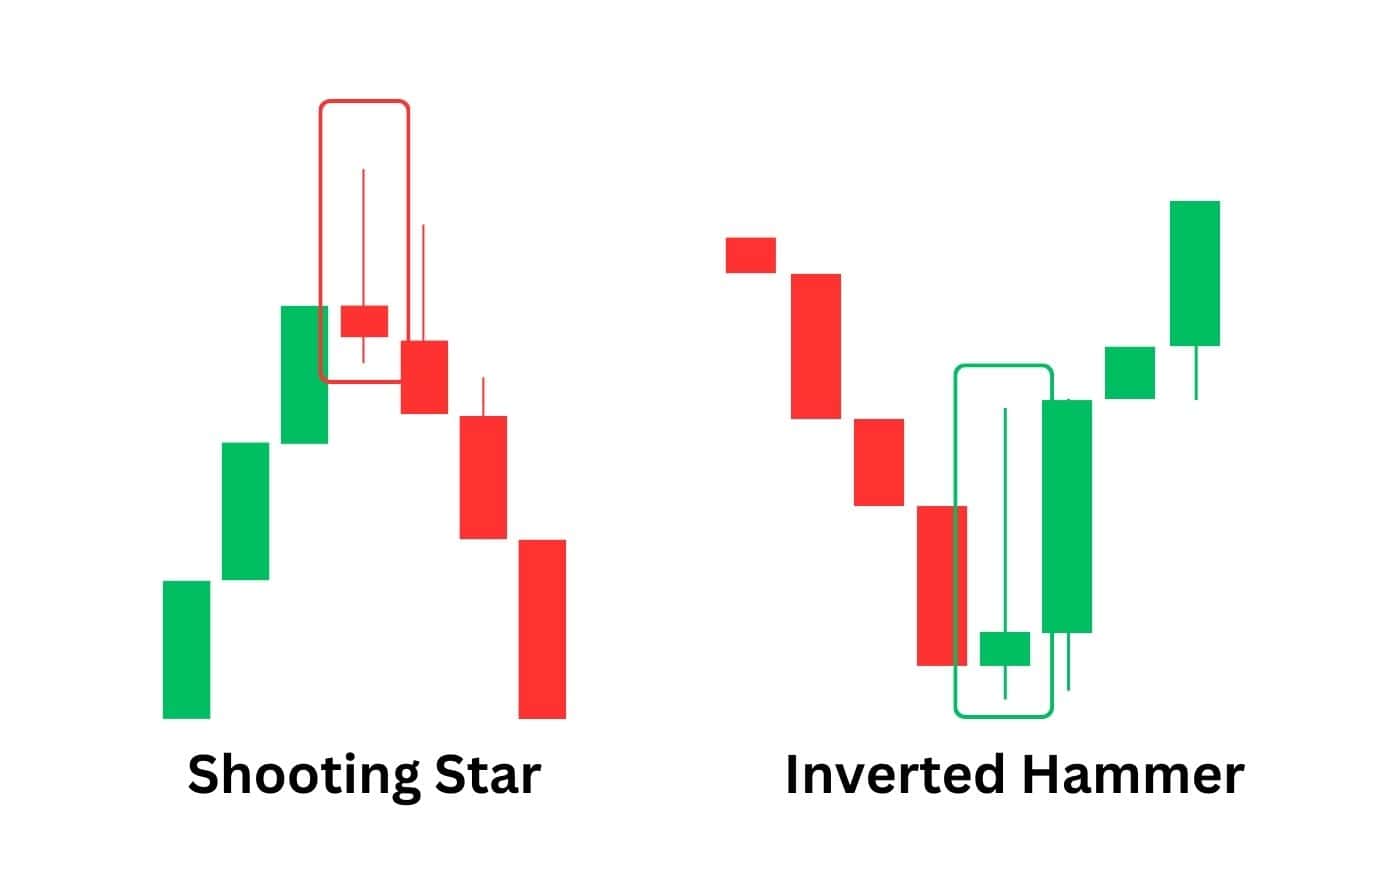
Shooting Star:
- Appears in an uptrend
- Small body at the bottom of the candle
- Long upper wick (at least 2x the body size)
- Little to no lower wick
- Body can be bullish or bearish
Inverted Hammer:
- Appears in a downtrend
- Small body at the bottom of the candle
- Long upper wick
- Little to no lower wick
- Body can be bullish or bearish
The Critical Misunderstanding: Here’s where most traders go wrong: They see a Shooting Star and immediately short, or they see an Inverted Hammer and immediately go long. Then they get stopped out and blame the pattern.
The truth is, both of these patterns require confirmation. They show rejection of higher prices, but that rejection needs to be followed through with actual downward (for Shooting Star) or upward (for Inverted Hammer) movement.
The Correct Way to Trade These Patterns:
For Shooting Stars:
- Wait for the next candle to open and start moving lower
- Enter when price breaks below the Shooting Star’s body
- Stop loss above the Shooting Star’s high
- Look for additional confirmation like bearish divergence on RSI
For Inverted Hammers:
- Wait for the next candle to open and start moving higher
- Enter when price breaks above the Inverted Hammer’s high
- Stop loss below the Inverted Hammer’s low
- Inverted Hammers are strongest at major support levels
Why the Confirmation Candle is Non-Negotiable: About 40% of Shooting Stars and Inverted Hammers fail to reverse. The confirmation candle eliminates most of these false signals. Yes, you’ll enter a bit later, but your win rate will improve dramatically.
Pro Insight: I’ve found that Shooting Stars work best on the 4-hour and daily timeframes, especially when they appear after a strong move into overbought territory. On lower timeframes (1-hour or below), they produce too many false signals to be reliable.
11. The Doji Patterns: Reading Market Indecision Like a Pro

Doji candles—where the open and close are virtually identical, represent market indecision. Most traders know what a doji IS, but very few know HOW to trade them effectively.
Types of Doji Patterns:
Standard Doji: Equal upper and lower wicks, open and close at or near the middle
Long-Legged Doji (Rickshaw Man): Very long upper and lower wicks showing extreme volatility and indecision
Dragonfly Doji: Long lower wick, no upper wick, open and close at the high of the candle
Gravestone Doji: Long upper wick, no lower wick, open and close at the low of the candle
Why 95% of Traders Fail with Dojis: The problem is that traders try to trade every doji they see, regardless of context. Dojis appear constantly in ranging markets where they mean absolutely nothing. The key is understanding WHEN dojis matter.
The Only Times Dojis Actually Matter:
- After extended trends: A doji after a strong uptrend or downtrend signals potential exhaustion
- At major support/resistance: Dojis at key levels show the market is undecided about breaking through
- Multiple dojis in a row: Two or three consecutive dojis often precede explosive moves
- After gap moves: A doji after a significant gap can signal the gap will be filled
Trading Dojis the Right Way:
Step 1—Context Check: Is this doji appearing in a location that matters? If not, ignore it completely.
Step 2—Direction Bias: Based on the overall trend and market structure, which direction is the doji more likely to resolve? A doji at the bottom of a downtrend is more likely to reverse up than down.
Step 3—Wait for Breakout: Do NOT trade the doji itself. Wait for the next candle to break above or below the doji’s range.
Step 4—Entry and Stop: Enter when price breaks the doji’s high or low. Stop goes on the opposite side of the doji.
Special Note on Dragonfly and Gravestone Dojis:
These specialized dojis are actually more reliable than standard dojis because they show clear rejection.
- Dragonfly Doji at support = bullish: Price tested lower but buyers rejected it
- Gravestone Doji at resistance = bearish: Price tested higher but sellers rejected it
When you see these at key levels with volume confirmation, they become some of the highest probability setups available.
12. The Spinning Top: The Pattern That Predicts Explosive Moves
The Spinning Top is perhaps the most ignored pattern on this entire list, yet it’s one of my personal favorites for predicting major market moves.

What It Looks Like: A candle with a small body (can be bullish or bearish) and long upper and lower wicks. The body should be in the middle third of the total candle range.
What It Means: Spinning Tops show that both buyers and sellers tried to control the market during that period, but neither side won. Price got pushed both up and down significantly, but ended near where it started.
Why This Pattern is Powerful: When Spinning Tops appear after strong trends or at key levels, they often precede explosive breakouts. The market is coiling, building energy, and ready to make a decisive move.
The Pattern Within the Pattern:
Watch for multiple Spinning Tops in a row. This is called consolidation through spinning tops, and it’s one of the most reliable precursors to major breakouts you’ll ever see.
When you spot 3-5 Spinning Tops forming at the end of a trend or at a key level, start preparing for a significant move. The direction of the breakout from this consolidation is often sharp and sustained.
How to Trade Spinning Top Consolidations:
- Identify the zone: Draw horizontal lines at the highs and lows of the spinning top cluster
- Wait for the breakout: Don’t try to predict which direction—let the market show you
- Enter on the breakout candle: When price breaks above or below the consolidation zone
- Stop loss: On the opposite side of the consolidation zone
- Target: Measure the height of the consolidation and project it in the breakout direction
Real Trading Example: In early 2023, EUR/USD formed six consecutive Spinning Tops on the daily chart between 1.0800 and 1.0850. This 50-pip range held for over a week. When price finally broke above 1.0850 with a strong bullish candle, it rallied 200+ pips over the next five days. Traders who recognized this pattern and entered on the breakout captured a 4:1 or better risk-to-reward ratio.
Comprehensive Comparison: Best Candlestick Patterns for Forex Trading
To help you quickly reference and compare these powerful trading candlestick patterns, I’ve created a detailed comparison table:
| Pattern Name | Type | Candles Required | Trend Context | Success Rate | Best Timeframe | Confirmation Needed |
|---|---|---|---|---|---|---|
| Three White Soldiers | Bullish Reversal | 3 | End of downtrend | 75-80% | Daily, 4H | Volume increase |
| Three Black Crows | Bearish Reversal | 3 | End of uptrend | 75-80% | Daily, 4H | Volume increase |
| Morning Star | Bullish Reversal | 3 | End of downtrend | 70-75% | Daily, 4H | Third candle > 50% of first |
| Evening Star | Bearish Reversal | 3 | End of uptrend | 70-75% | Daily, 4H | Third candle > 50% of first |
| Piercing Pattern | Bullish Reversal | 2 | End of downtrend | 65-70% | 4H, 1H | Gap down + close > 50% |
| Dark Cloud Cover | Bearish Reversal | 2 | End of uptrend | 65-70% | 4H, 1H | Gap up + close < 50% |
| Tweezer Bottom | Bullish Reversal | 2-3 | End of downtrend | 70-75% | Daily, 4H | Identical lows at support |
| Tweezer Top | Bearish Reversal | 2-3 | End of uptrend | 70-75% | Daily, 4H | Identical highs at resistance |
| Bullish Harami | Bullish Reversal | 2 | End of downtrend | 60-65% | Daily, 4H | Next candle confirms |
| Bearish Harami | Bearish Reversal | 2 | End of uptrend | 60-65% | Daily, 4H | Next candle confirms |
| Bullish Engulfing | Bullish Reversal | 2 | End of downtrend | 70-80% | All timeframes | Size ratio > 1.5x |
| Bearish Engulfing | Bearish Reversal | 2 | End of uptrend | 70-80% | All timeframes | Size ratio > 1.5x |
| Shooting Star | Bearish Reversal | 1 | End of uptrend | 60-65% | 4H, Daily | Next candle confirms |
| Inverted Hammer | Bullish Reversal | 1 | End of downtrend | 60-65% | 4H, Daily | Next candle confirms |
| Dragonfly Doji | Bullish Reversal | 1 | At support | 65-70% | Daily, 4H | At key levels only |
| Gravestone Doji | Bearish Reversal | 1 | At resistance | 65-70% | Daily, 4H | At key levels only |
| Spinning Top Cluster | Breakout Setup | 3-5 | After trend/at levels | 75-85% | Daily, 4H | Directional breakout |
Important Notes on the Table:
- Success rates assume proper context and confirmation
- Higher timeframes generally produce more reliable signals
- All patterns work best at key support/resistance levels
- Volume confirmation significantly improves success rates
How to Trade Candlestick Patterns Successfully: The Complete Framework
Knowing these 12 powerful candlestick chart patterns is only half the battle. The other half—the part that actually makes you money—is knowing how to trade them properly within a comprehensive risk management framework.
The Five-Step Candlestick Trading System
Step 1: Identify the Overall Trend
Before you even look for candlestick patterns, you need to know what the market is doing on a larger scale. Are we in an uptrend, downtrend, or range?
Use these tools to identify trends:
- Moving averages: Is price above or below the 50 and 200-period moving averages?
- Higher highs/higher lows: In an uptrend, price makes higher highs and higher lows
- Lower highs/lower lows: In a downtrend, price makes lower highs and lower lows
- Market structure: Draw your support and resistance zones
The Rule: Trade reversal patterns (like Morning Star, Evening Star, Engulfing) at the END of trends. Trade continuation patterns at the MIDDLE of trends.
Step 2: Mark Your Key Levels
Candlestick patterns that form at key support and resistance levels are exponentially more powerful than random patterns in the middle of nowhere.
Spend 10-15 minutes each day marking:
- Major support and resistance zones (horizontal levels where price has reversed multiple times)
- Psychological levels (round numbers like 1.3000, 1.2500, etc.)
- Fibonacci retracement levels from recent major moves
- Previous highs and lows on daily and weekly charts
- Moving averages as dynamic support/resistance
When a powerful candlestick pattern forms at one of these key levels, your probability of success increases dramatically.
Step 3: Wait for Your Pattern to Form
This is where patience becomes your greatest asset. Most traders lose money because they can’t wait for proper setups. They see something that almost looks like their pattern and jump in, only to get stopped out.
Patience checklist:
- ✓ Has the entire pattern completed? (Don’t enter before the last candle closes)
- ✓ Does it meet all the requirements for the pattern? (50% rule for Piercing/Dark Cloud, gap for Morning/Evening Star, etc.)
- ✓ Is it at a key level that matters?
- ✓ Is the overall market structure supporting this trade direction?
Step 4: Confirm Before Entry
For most patterns (especially single-candle patterns like Shooting Stars and Hammers), you need confirmation before entering.
Confirmation techniques:
- Volume: Is there above-average volume supporting the pattern?
- Next candle- Does the candle after the pattern move in your intended direction?
- Indicator divergence: Is there bullish/bearish divergence on RSI or MACD?
- Multiple timeframe alignment: Does the pattern on the 4H chart align with the daily chart structure?
Step 5: Execute with Proper Risk Management
This is where most traders destroy their accounts. They nail the pattern identification but then risk too much or don’t manage the trade properly.
Risk management rules:
- Never risk more than 1-2% of your account on any single trade
- Always use a stop loss—no exceptions, ever
- Position size based on your stop distance, not on how confident you feel
- Use appropriate risk-to-reward ratios—aim for at least 1:2, preferably 1:3 or better
- Don’t move stops against yourself (never move a stop further away to avoid being stopped out)
Combining Candlestick Patterns with Technical Indicators for Maximum Accuracy
While candlestick patterns are powerful on their own, combining them with complementary technical indicators can significantly improve your win rate and help you filter out false signals.
The Best Indicator Combinations for Candlestick Trading
1. RSI (Relative Strength Index) + Candlestick Patterns
The RSI measures momentum and helps identify overbought (above 70) and oversold (below 30) conditions.
How to combine:
- Bullish reversal patterns (Morning Star, Bullish Engulfing) are more reliable when RSI is below 30 and showing bullish divergence
- Bearish reversal patterns (Evening Star, Bearish Engulfing) work best when RSI is above 70 with bearish divergence
- Divergence confirmation: When price makes a new low but RSI makes a higher low (bullish divergence), watch for bullish candlestick patterns
2. MACD (Moving Average Convergence Divergence) + Candlestick Patterns
MACD shows trend direction and momentum shifts through the interaction of two moving averages and a signal line.
Powerful combinations:
- Wait for MACD crossovers that align with your candlestick pattern
- Bullish patterns are stronger when MACD is crossing above the signal line
- Bearish patterns are stronger when MACD is crossing below the signal line
- MACD divergence + candlestick pattern = extremely high probability setup
3. Moving Averages + Candlestick Patterns
Moving averages show the average price over a specific period and act as dynamic support and resistance.
Strategic use:
- 50-period MA: Great for identifying short to medium-term trends
- 200-period MA: The ultimate trend indicator
- Patterns near MAs: Candlestick reversal patterns that form right at the 50 or 200 MA often produce strong bounces
- MA crossovers: When a bullish candlestick pattern coincides with the 50 MA crossing above the 200 MA (golden cross), it’s extremely bullish
4. Support/Resistance Levels + Candlestick Patterns
This is perhaps the most important combination. Support and resistance levels represent price zones where historical buying and selling pressure has been significant.
Key principles:
- Candlestick patterns at major support in a downtrend = high-probability reversal
- Candlestick patterns at major resistance in an uptrend = high-probability reversal
- The more times a level has been tested, the more significant the candlestick pattern that forms there
- Psychological levels (1.0000, 1.5000, etc.) combined with strong candlestick patterns create explosive moves
The Confluence Strategy: Stacking Probabilities in Your Favor
The most successful forex traders don’t trade every candlestick pattern they see. They wait for confluence—when multiple factors align to create a high-probability setup.
High-Probability Confluence Checklist:
✓ Strong candlestick pattern forms (one of our 12 powerful setups) ✓ Pattern appears at a key support/resistance level ✓ RSI shows overbought/oversold and potential divergence ✓ MACD confirms the direction with a crossover ✓ Price is at or near a significant moving average ✓ Volume confirms the pattern (above average on reversal candle) ✓ Multiple timeframe analysis shows alignment (daily and 4H pointing same direction)
When you have 4-5 of these factors lining up, you’ve found a trade worth taking. When you only have 1-2 factors, it’s better to pass and wait for a better opportunity.
Example of Perfect Confluence:
Let’s say you’re watching EUR/USD on the daily chart:
- Price has been in a downtrend for 3 weeks
- It reaches the 1.0500 level (major support tested 3 times in the past 6 months)
- A Morning Star pattern forms at this level
- RSI is at 28 (oversold) and showing bullish divergence
- MACD histogram is starting to turn positive
- Volume on the third candle of the Morning Star is 50% above average
- The 4-hour chart also shows a bullish engulfing at the same level
This is a 7-factor confluence trade. Your probability of success on this setup is likely 75-80% or higher. This is what you wait for. This is where you risk your capital.
Common Mistakes That Kill Traders: Causes and Solutions for Chronic Overtrading
Even with knowledge of these powerful candlestick patterns, many traders still lose money. The reason? They sabotage themselves with poor emotional discipline and chronic overtrading.
The Overtrading Epidemic
Overtrading is the silent account killer. It’s not as dramatic as a single catastrophic loss, but it’s far more common and equally destructive. Overtrading happens when you take too many trades, often with insufficient setup quality, because of emotional reasons rather than strategic ones.
Why Traders Overtrade:
1. Boredom and Need for Action The forex market is open 24 hours, and there’s always something moving. Many traders feel they need to be “doing something” to justify sitting at their screens. This leads to forcing trades that don’t meet their criteria.
2. Trying to Recover Losses (Revenge Trading) After a losing trade, the emotional urge to “get your money back” is overwhelming. Traders start taking marginal setups, lowering their standards, and increasing position sizes—a recipe for disaster.
3. FOMO (Fear of Missing Out) You see a move happening and panic that you’re missing an opportunity. You jump in without proper analysis, often entering after the best part of the move is already over.
4. Lack of Defined Criteria Without clear rules for what constitutes a valid trade setup, every pattern looks tradeable. You need specific, objective criteria for entry.
5. Inadequate Risk Management When you don’t properly calculate position sizes or respect your daily loss limits, it becomes too easy to take “just one more trade.”
Solutions: Building Emotional Discipline Techniques for Consistent Trading
Solution 1: Create Your Trade Checklist
Write down the EXACT criteria that must be met before you enter a trade. Make this checklist physical—print it out and keep it next to your computer.
Example Checklist:
- Pattern is one of my 12 approved setups
- Pattern is at a key support/resistance level
- RSI shows overbought/oversold condition
- At least 3 factors of confluence present
- Risk-to-reward ratio is minimum 1:2
- I have not exceeded my daily trade limit (3 trades max)
- My stop loss is clearly defined and within my risk parameters
- I can afford to lose this trade without emotional impact
If you can’t check ALL boxes, you don’t take the trade. Period.
Solution 2: Implement Hard Trade Limits
Set clear boundaries that you cannot cross:
- Maximum trades per day: 2-3 trades
- Maximum daily loss: 3-5% of account
- Maximum risk per trade: 1-2% of account
When you hit these limits, you’re done for the day. Close your trading platform and walk away.
Solution 3: The 24-Hour Rule
When you spot a setup you want to trade, especially if you’re feeling emotional, force yourself to wait 24 hours before entering. If the setup is still valid the next day and still meets all your criteria, then take it.
This single rule eliminates most emotional, impulsive trades. Truly great setups don’t disappear in 24 hours. If the opportunity is gone, there will be others.
Solution 4: Trading Journal with Emotional Tracking
Keep a detailed journal that tracks not just your trades but your emotional state:
- How did you feel before the trade? (confident, anxious, bored, revenge-minded?)
- How did you feel during the trade?
- How did you feel after the trade?
- Did you follow your rules completely?
After 30-50 trades, patterns will emerge. You’ll notice that trades taken when you felt “bored” or “revenge-minded” lose money, while trades taken when you felt “patient” and “confident in confluence” make money.
Solution 5: Reduce Chart Time
This sounds counterintuitive, but many traders improve dramatically when they REDUCE the time spent staring at charts. Here’s why: The more you watch, the more patterns you “see,” and the more tempted you are to trade.
Instead:
- Set price alerts for key levels
- Check charts 2-3 times per day at scheduled times
- Use higher timeframes (4H, Daily) that don’t require constant monitoring
- When you’re not in a trade, do something else—go for a walk, read, exercise
The market will present opportunities whether you’re watching every minute or not. The opportunities you miss by not staring at charts are far outweighed by the bad trades you avoid.
Solution 6: Focus on Quality Over Quantity
Shift your mindset from “How many trades can I take?” to “How can I take only the absolute best trades?”
Professional traders often take only 5-10 trades per month. They wait patiently for perfect setups where multiple factors align. When those setups appear, they act decisively and with appropriate size.
Amateur traders take 5-10 trades per day, most of which are mediocre setups that slightly resemble something they learned. They win some and lose some, but the transaction costs and emotional toll grind them down.
Which type of trader do you want to be?
Real-World Examples: Putting It All Together
Let’s walk through some real scenarios showing how to apply these candlestick patterns with proper context and risk management.
Example 1: GBP/USD Morning Star at Major Support
Context: GBP/USD has been in a downtrend for 3 weeks, falling from 1.2800 to 1.2400. Price reaches 1.2380, a level that acted as support twice in the previous 2 months.
Day 1: A long bearish candle closes at 1.2380, continuing the downtrend.
Day 2: A small-bodied doji forms at 1.2370, showing indecision. This is our “morning star” middle candle.
Day 3: A strong bullish candle opens at 1.2375 and closes at 1.2435, engulfing more than 70% of the first candle’s body. Volume on this candle is 40% above the 10-day average.
Confluence Factors:
- Morning Star pattern (3 candles) ✓
- At major support level (1.2380) ✓
- RSI at 26 (oversold) ✓
- MACD showing bullish divergence ✓
- High volume on reversal candle ✓
- 5 factors = High-probability trade
Trade Execution:
- Entry: 1.2440 (after third candle closes)
- Stop loss: 1.2350 (below the support and pattern low) = 90 pips
- First target: 1.2620 (previous resistance) = 180 pips
- Risk-to-reward: 1:2
- Position size: Risk 1.5% of account, which equals 1.67 mini lots per $10,000 account
Outcome: Price rallied to 1.2615 over the next 5 days, hitting the target for a 180-pip winner.
Example 2: EUR/USD Bearish Engulfing at Resistance
Context: EUR/USD has been rallying for 10 days straight, moving from 1.0700 to 1.0950. The 1.0950-1.1000 zone represents major resistance (previous highs from 3 months ago).
Setup: Price pushes to 1.0985 with a bullish candle. The next day, a massive bearish candle opens at 1.0990, reaches 1.1010 (testing resistance), then closes at 1.0920 completely engulfing the previous bullish candle.
Confluence Factors:
- Bearish Engulfing pattern ✓
- At major resistance zone ✓
- RSI at 78 (overbought) ✓
- Price rejected exactly at 1.1000 psychological level ✓
- Engulfing candle is 2.5x the size of previous candle ✓
- 5 factors = High-probability trade
Trade Execution:
- Entry: 1.0915 (confirmation on next candle moving lower)
- Stop loss: 1.1020 (above the resistance and pattern high) = 105 pips
- First target: 1.0700 (previous support) = 215 pips
- Risk-to-reward: 1:2+
- Position size: Risk 2% of account
Outcome: Price fell to 1.0720 over the next week, nearly hitting the full target for a 195-pip winner.
Example 3: USD/JPY Tweezer Top Failure (Learning from Losses)
Not every pattern works, and it’s important to understand why some trades fail.
Context: USD/JPY has been in an uptrend, reaching 112.50. Two consecutive daily candles form highs at 112.48 and 112.51 (essentially a tweezer top).
Problem: While this is technically a tweezer top, several warning signs were ignored:
- The overall trend is still strongly bullish (uptrend intact)
- No RSI overbought condition (RSI at 58)
- No resistance level in this area (112.50 is not a significant historical level)
- Volume on the tweezer candles is below average (no selling pressure)
Mistake: A trader sees the tweezer pattern and enters short at 112.40, with a stop at 112.60 (20 pips).
Outcome: Price consolidates briefly, then breaks higher to 113.20, stopping out the trade for a 20-pip loss.
Lesson: The pattern appeared in isolation without proper confluence. The trend was still bullish, there was no resistance to provide context, and no indicators suggested a reversal was likely. This is a perfect example of “pattern recognition without context”—the fatal flaw that kills accounts.
What should have been done: Skip this trade entirely. There were only 1-2 confluence factors instead of the required 4-5. Wait for better setups.
Mastering Your Trading Psychology: The Final Piece of the Puzzle
You now know 12 powerful candlestick patterns. You understand how to combine them with indicators and confluence. You’ve learned proper risk management and how to avoid overtrading.
But here’s the hard truth: Knowledge alone won’t make you profitable.
The forex market is 80% psychology and 20% strategy. You can have the best trading system in the world, but if you can’t control your emotions, you’ll still lose money.
The Four Psychological Pillars of Successful Trading
Pillar 1: Patience
Patience is not just waiting for setups, it’s having the discipline to not force trades when conditions aren’t right.
How to develop patience:
- Remind yourself daily: “There will always be another opportunity”
- Track “trades not taken” in your journal—celebrate avoiding bad setups
- Set a minimum confluence requirement (4-5 factors) before any trade
- Accept that some days/weeks have no valid trades, and that’s perfectly fine
Pillar 2: Discipline
Discipline means following your rules even when your emotions scream at you to break them.
How to build discipline:
- Write your trading rules down and review them before every session
- Use checklists that must be completed before entering any trade
- Set hard stops and limits that you cannot override
- Accept small losses as the cost of doing business—they’re not failures, they’re inevitable
Pillar 3: Emotional Detachment
Every trade is just a probability play. Some will win, some will lose. Your job is to execute your system consistently and let the probabilities work out over many trades.
How to achieve detachment:
- Never risk more than you can afford to lose comfortably
- View each trade as one in a series of 100—individual results don’t matter
- Avoid checking trades every 5 minutes—set your stop and target, then step away
- Practice meditation or mindfulness to develop emotional awareness
Pillar 4: Continuous Learning
The market evolves. Strategies that worked last year might not work this year. Successful traders never stop learning and adapting.
How to keep learning:
- Review every trade in your journal, especially losses
- Identify patterns in your mistakes
- Study charts daily, even when not trading
- Connect with other serious traders to exchange ideas
- Read books and articles on both trading strategy and psychology
Frequently Asked Questions About Candlestick Patterns
Q: How long does it take to master candlestick patterns?
A: With focused study and practice, you can learn to identify these 12 patterns within 2-3 weeks. However, truly mastering them—understanding context, confluence, and proper execution—typically takes 6-12 months of live trading experience. The key is quality practice: review historical charts, mark patterns, and track their success rates in your market and timeframe.
Q: Which timeframe is best for trading candlestick patterns?
A: For most forex traders, the 4-hour and daily timeframes produce the most reliable candlestick patterns. These timeframes filter out the noise of shorter periods while still providing enough trading opportunities. Beginners should focus exclusively on daily charts until they develop consistent profitability.
Q: Can candlestick patterns be automated or traded with algorithms?
A: While some basic patterns can be programmed into trading algorithms, the contextual elements that make patterns truly powerful (trend analysis, support/resistance, confluence) are difficult to automate effectively. Candlestick patterns work best when combined with human judgment about market context and conditions.
Q: Do candlestick patterns work in all market conditions?
A: No. Candlestick patterns work best in trending or clearly defined ranging markets. During high-impact news events, flash crashes, or extremely low liquidity periods, patterns become unreliable. Always check the economic calendar and avoid trading around major news releases unless you’re very experienced.
Q: How many patterns should I focus on as a beginner?
A: Start with just 3-4 patterns: Bullish and Bearish Engulfing, Morning Star, and Evening Star. Master these completely before adding others. It’s better to trade a few patterns with deep understanding than to know many patterns superficially.
Q: What’s the biggest mistake traders make with candlestick patterns?
A: Trading patterns without context. A Morning Star in the middle of a range is meaningless. The same Morning Star at major support after a 300-pip decline is powerful. Always ask: “Where is this pattern forming, and why does this location matter?”
Q: How important is volume confirmation with candlestick patterns?
A: Very important. Volume shows conviction behind the price movement. A pattern with above-average volume has a much higher probability of success than one with weak volume. However, forex volume data can be less reliable than stock volume since forex is decentralized. Use volume as one factor among many, not as a sole confirmation.
Q: Should I trade counter-trend patterns or trend-following patterns?
A: Both have their place. Trend-following patterns (like continuation patterns) generally have higher win rates but smaller individual gains. Counter-trend reversal patterns have lower win rates but can catch huge moves when they work. Most successful traders focus on trend-following setups for 70-80% of their trades.
Q: How do I know if a pattern has failed?
A: A pattern has failed when price moves against your intended direction and hits your stop loss. More importantly, you should exit if the reason you entered the trade is no longer valid—for example, if you entered a bullish pattern at support but price breaks below that support level, exit immediately rather than hoping for a recovery.
Q: Can I trade these patterns with a small account ($500-$1000)?
A: Yes, but you must use proper position sizing and risk management. With a small account, risk only 1% per trade maximum. This means on a $500 account, you risk $5 per trade. Use micro lots (0.01) to ensure your stop loss distance doesn’t force you to risk more than this amount. Focus on quality over quantity—you don’t need many trades; you need good trades.
Conclusion: Your Path Forward to Profitable Candlestick Trading
You’ve now learned something that 95% of traders either don’t know or ignore: the 12 most powerful candlestick patterns in forex trading, along with the complete framework for trading them successfully.
But here’s where most traders fail: They read articles like this, feel excited and motivated, then do nothing with the information. They go back to their old habits, continue taking random trades, and keep losing money.
Don’t be that trader.
The path to consistent profitability with candlestick patterns requires three commitments:
Commitment 1: Deep Practice
Spend the next 30 days doing nothing but studying these patterns on historical charts. Open your charting platform, go back 1-2 years, and mark every instance of these patterns you can find. Note which ones worked and which failed. Study the context around each pattern.
This deliberate practice will wire these patterns into your brain. After 30 days of this, you’ll spot them instantly in real-time trading.
Commitment 2: Systematic Application
Create your trading checklist based on what you’ve learned in this article. Print it out. Keep it next to your computer. Before every single trade, go through the checklist. If you can’t check all the boxes, you don’t take the trade.
No exceptions. No “just this once.” No “I have a feeling about this one.”
Your checklist is your protection against emotional trading and the discipline tool that separates you from losing traders.
Commitment 3: Long-Term Perspective
Understand that mastering candlestick trading is a marathon, not a sprint. You will have losing trades. You will have losing weeks. Even with perfect pattern recognition and execution, you’ll win maybe 60-70% of your trades at best.
Success comes from consistent application of your system over hundreds of trades, not from trying to hit home runs on individual setups.
The Reality Check
I need to be honest with you: Most traders who read this article won’t succeed. Not because the information doesn’t work—it absolutely does. But because they won’t put in the work required to master it.
They’ll skim through, think “that’s interesting,” bookmark the page, and go back to taking random trades based on gut feelings and YouTube videos.
But you can be different.
You can be part of the 5% who actually makes money in forex trading. The path is clear:
- Master these 12 patterns through deliberate study and practice
- Understand context and confluence—never trade a pattern in isolation
- Implement rigid risk management—risk 1-2% maximum per trade
- Develop emotional discipline—follow your rules without exception
- Be patient—wait only for the highest-probability setups
- Keep learning—review every trade and continuously improve
The forex market doesn’t care about your feelings, your opinions, or your financial needs. It’s a pure meritocracy where skill, discipline, and patience are rewarded, and impulsiveness, emotion, and ignorance are punished.
You now have the knowledge. The question is: Do you have the discipline to apply it?
The market will be open tomorrow. There will be opportunities. The question isn’t whether they’ll appear—the question is whether you’ll be prepared to recognize them and execute them properly when they do.
Your trading journey transforms today. The 12 patterns you’ve learned, combined with the framework for trading them, give you a genuine edge in the market.
But knowledge without action is worthless.
So here’s what you do next:
- Save this article for reference
- Create your trading checklist today
- Spend the next week reviewing historical charts and marking these patterns
- Paper trade these setups for 2-3 weeks before risking real money
- When you go live, start small—prove the system works with small positions before scaling up
The difference between where you are now and where you want to be isn’t luck. It isn’t some secret indicator or expensive course. It’s simply this: consistent application of proven patterns with proper risk management and emotional discipline.
You have everything you need. The only question is: Will you use it?
The market is waiting. Your future trading account—dramatically larger and more consistent than it is today—is waiting. The opportunities are waiting.
Stop waiting. Start applying. Master these patterns. Transform your trading.
The time to act is now. Every day you delay is another day of potential profits left on the table. Every pattern you miss because you haven’t trained yourself to recognize it is money flowing to traders who have done the work.
Be the trader who does the work. Be the 5%.
About the Author: This article represents insights gained from over a decade of active forex trading, hundreds of thousands of dollars in both wins and losses, and continuous study of price action and market psychology. While no trading system guarantees profits, the patterns and frameworks discussed have been extensively tested in live market conditions across multiple currency pairs and timeframes