Forex Breakout Strategy: 7 Powerful Secrets to Trade Breakouts Successfully (That Most Traders Never Discover)
Introduction: Are You Leaving Massive Profits on the Table?
Let’s be brutally honest for a second. How many times have you spotted what looked like a perfect forex breakout — price pushing decisively through a key level, your fingers hovering over the ‘buy’ button, your pulse quickening with anticipation — only to watch the whole thing collapse against you within minutes? The price reverses. Your stop-loss gets triggered. And you’re left staring at the screen wondering what just happened.
If that sounds familiar, you are absolutely not alone. In fact, studies suggest that in forex markets, roughly 60–70% of apparent breakouts turn out to be false signals — traps deliberately sprung by institutional players designed to lure in retail traders and shake them out before the real move begins. That is a sobering statistic. And if you’ve been trading breakouts without a clear, disciplined framework, chances are that statistic has been quietly bleeding your account dry.
But here’s the exciting flip side of that coin: when you know how to trade forex breakouts correctly — when you can separate the genuine, high-probability breakouts from the fakeouts, when you’ve got a clear entry plan, a rock-solid risk management framework, and the patience to execute — breakout trading becomes one of the most powerful and profitable strategies available to any forex trader, beginner or veteran.
This guide is your complete, no-fluff deep dive into the forex breakout strategy. We’re going to cover everything: what breakouts actually are, why they work, how to identify the best breakout chart patterns, how to filter out the fakes, when to enter and exit, and how to manage your risk like a professional. Whether you’re just getting started or you’ve been at this for years and want to sharpen your edge, there’s something in here for you.
And if you’re the type of trader who wants a systematic, automated approach that removes the guesswork entirely, we’ll also touch on how tools like the VTM Automated System can help you execute breakout strategies with discipline and consistency.
Let’s get into it.
What Is a Forex Breakout Strategy? The Foundation You Can’t Ignore
Defining the Forex Breakout
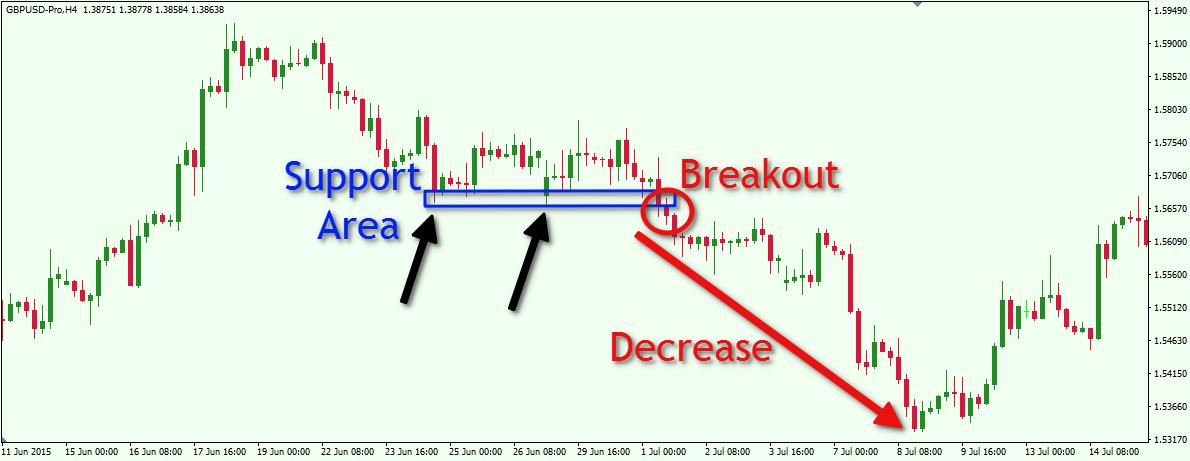
At its core, a forex breakout occurs when the price of a currency pair moves decisively beyond a well-defined level of support or resistance. Think of it like a coiled spring. For a period of time — days, weeks, sometimes months — the market compresses within a narrow range, with price bouncing between a ceiling (resistance) and a floor (support). Then, suddenly, the spring releases. Price breaks through one of those boundaries with force, and a new trend begins.
As defined by breakout trading experts at Daily Price Action, a breakout is “any price movement outside a defined support or resistance area” — it can occur at a horizontal level or a diagonal one, depending on the price action pattern. The key implication? The longer the market has been consolidating, the more volatile and powerful the eventual breakout tends to be.
Why Breakout Trading Works: The Psychology Behind the Move
To really understand why breakout trading works, you need to understand what’s happening under the surface. A support or resistance level isn’t just a line on a chart — it represents a psychological battleground where buyers and sellers have repeatedly clashed, and where large volumes of stop-loss orders and pending buy/sell orders are clustered.
When the price finally pierces that level with conviction, several things happen simultaneously:
- Trapped traders panic: Sellers who placed short positions above resistance are now ‘trapped’ and must buy back to close their losing trades, adding upward fuel.
- New momentum traders pile in: Breakout traders who’ve been waiting for a confirmed break enter in the direction of the move, adding more buying or selling pressure.
- Stop orders trigger: Clusters of stop-loss orders placed just beyond the level are hit, creating a cascade of orders in the direction of the breakout.
- Algorithmic systems react: Automated trading programs detect the level break and execute instantly, compressing the move into a short, powerful surge.
The result? A self-reinforcing wave of momentum that, in genuine breakouts, can carry price far beyond the original level. This is why some of the most explosive moves in the forex market originate from well-formed breakout setups.
Continuation Breakouts vs. Reversal Breakouts
Not all breakouts are equal, and one of the first distinctions you need to understand is the difference between a continuation breakout and a reversal breakout.
- Continuation Breakout: This occurs when price breaks in the same direction as the prevailing trend after a period of consolidation. Think of a bull market pausing to ‘catch its breath’ in a tight flag or triangle formation, then breaking higher. These are generally higher-probability setups because you’re trading with the trend.
- Reversal Breakout: This happens when price breaks against the prevailing trend, signaling a potential change in market direction. A classic example is a double top formation, where price makes two peaks at the same resistance level, then breaks below the support between them, signaling a trend reversal. These require additional confirmation and are more risky for beginners.
For most traders — especially those new to breakout trading — focusing on continuation breakouts in the direction of the higher-timeframe trend is the smartest starting point. It dramatically increases your probability of success.
How to Identify True Breakouts in Forex Trading: The 5-Point Checklist
This is arguably the most critical skill you will ever develop as a breakout trader. Getting this wrong is what separates the traders who blow accounts from the ones who build them. Let’s build you a concrete checklist.
1. Quality of the Support/Resistance Level
Not every line drawn on a chart is worth trading. A high-quality level has certain characteristics:
- Multiple touches: The level should have been tested and respected at least 2–3 times previously. The more times price has bounced off a level, the more significant it is — and paradoxically, the more explosive the breakout when it finally happens.
- Clear, visible on higher timeframes: Levels that are obvious on the daily or 4-hour chart carry more weight than micro-levels on 5-minute charts.
- Clean structure: The level should be clean and horizontal (or clearly diagonal in the case of trend lines and wedges), not messy or ambiguous.
One useful observation: in forex markets, the most powerful breakouts frequently occur at levels that have held for the longest time. A resistance level that has capped price for six months contains far more pent-up energy than one that formed last week.
2. Volume Confirmation — The Single Most Important Filter
If there’s one thing that separates professional breakout traders from amateurs, it’s their obsession with volume. A breakout without a corresponding surge in trading volume is a major red flag.
As outlined by experts at EBC Financial Group, breakouts that are accompanied by increased volume signal a genuine shift in market participation — new buyers or sellers entering the market with conviction. Without sufficient volume, the breakout is likely driven by stop-loss triggers alone, and once those are exhausted, price typically snaps back.
Practical application: Look for volume on the breakout candle to be at least 20–30% above the recent average. On platforms like TradingView, you can set simple alerts for this.
3. The Strength of the Breakout Candle
The candle that breaks the level tells you a great deal about whether the move is real. A high-quality breakout candle typically has:
- A large body: The candle should close decisively beyond the level, not just poke its wick through it. A wick penetration that reverses is often a fakeout in disguise.
- Minimal upper shadow (for bullish breaks): A long upper wick on a bullish breakout candle means sellers fought back aggressively — a warning sign.
- A close beyond the level, not just a touch: Wait for the candle to close above resistance or below support. Intra-candle moves that close back inside the range are almost always traps.

4. Alignment with the Higher-Timeframe Trend
Here’s a rule that will save you more money than almost any other: never trade a breakout that goes against the higher-timeframe trend unless you have exceptionally strong confirmation.
If the daily chart is in a clear uptrend and you’re trading the 4-hour chart, only take bullish breakouts. Fighting the higher-timeframe trend is one of the fastest ways to drain your account. The trend on the timeframe above yours is your compass. Always consult it before entering a breakout trade.
5. Market Session and Timing
In forex, timing is everything. Breakouts that occur during low-liquidity periods — such as the end of the New York session or the overlap between the New York close and the Tokyo open — are far more likely to be fakeouts. Institutional players know that thin liquidity makes it easy to push price through levels without genuine commitment.
The highest-quality breakouts typically form during:
- The London session open (08:00–10:00 GMT) — when European institutions enter the market
- The New York session open (13:00–15:00 GMT) — when U.S. institutions add liquidity
- The London/New York overlap (13:00–17:00 GMT) — the single highest-liquidity window of the trading day
Avoid trading breakouts during the Asian session unless there’s a significant news catalyst, as the lower liquidity dramatically increases the risk of fakeouts.
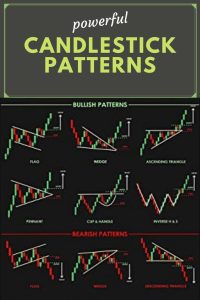
The Best Forex Breakout Patterns for Consistent Profits
Understanding the chart patterns that most reliably produce high-probability breakouts is the next pillar of your breakout education. These are the setups that experienced traders hunt for every single day.
1. The Rectangle / Range Breakout
This is the most classic and straightforward breakout pattern. Price consolidates between two clear horizontal levels — a resistance ceiling and a support floor — forming a rectangular box. The longer the range, the more energy is compressed, and the more powerful the eventual breakout tends to be.
How to trade it: Mark the top and bottom of the range clearly. Wait for a candle to close decisively beyond either level with volume confirmation. Enter on the breakout close or on the first pullback to the broken level.
2. The Triangle Breakout (Symmetrical, Ascending, Descending)
Triangles are formed by converging trend lines and represent a period of decreasing volatility before an explosive expansion. There are three main variants:
- Symmetrical Triangle: Both trend lines converge equally. The breakout can occur in either direction — trade whichever way price breaks, confirmed by the higher-timeframe trend.
- Ascending Triangle: A flat resistance ceiling with rising support lows. This is a bullish pattern — price is making higher lows, signaling buyers are becoming more aggressive. A break above the flat resistance is the signal.
- Descending Triangle: A flat support floor with falling resistance highs. This is a bearish pattern. A break below the flat support is the signal.
3. The Wedge Breakout
The wedge is one of the most powerful and profitable breakout patterns in forex, and it’s a personal favorite of experienced price action traders. As described in detail at Daily Price Action, a wedge forms when price is contained between two converging trend lines — one acting as support and one as resistance. Unlike triangles, both lines slope in the same direction.
The key insight about wedges: the longer the market consolidates within the wedge, the more volatile the breakout will be. A wedge that has been forming for 180 days on the daily chart has the potential to produce a multi-hundred pip move. These are the kinds of setups that can define your trading month or even your trading year.
Trade it by entering on a clean break and close outside the wedge boundary, with a stop just back inside the pattern and a target at the widest point of the wedge pattern projected from the breakout point.
4. The Flag and Pennant Breakout
Flags and pennants are short-term consolidation patterns that form after a sharp, impulsive price move (the ‘flagpole’). They represent a brief pause — a moment of breath — before the trend resumes.
- Bullish Flag: A sharp rally followed by a slight downward channel consolidation. A break above the upper channel line signals a continuation of the uptrend.
- Bearish Flag: A sharp decline followed by a slight upward channel consolidation. A break below the lower channel line signals a continuation of the downtrend.
Flags and pennants are continuation patterns, which means they align with the prevailing trend — making them among the highest-probability setups available to breakout traders.
Forex Breakout Strategy Comparison Table
Use this quick-reference table to compare the most popular breakout patterns, their typical win rates, ideal timeframes, and risk-to-reward characteristics:
| Breakout Pattern | Pattern Type | Typical R:R | Best Timeframe | Win Rate (Approx.) | Difficulty Level |
| Rectangle / Range | Continuation or Reversal | 1:2 – 1:3 | 4H / Daily | 55–65% | Beginner |
| Ascending Triangle | Continuation (Bullish) | 1:2 – 1:4 | 4H / Daily | 60–70% | Beginner |
| Descending Triangle | Continuation (Bearish) | 1:2 – 1:4 | 4H / Daily | 60–70% | Beginner |
| Symmetrical Triangle | Continuation or Reversal | 1:2 – 1:3 | Daily / Weekly | 50–60% | Intermediate |
| Bullish / Bearish Wedge | Continuation or Reversal | 1:3 – 1:5+ | Daily | 60–70% | Intermediate |
| Flag / Pennant | Continuation | 1:2 – 1:3 | 1H / 4H | 65–75% | Beginner |
| Break & Retest | Continuation | 1:2 – 1:4 | 4H / Daily | 65–75% | Intermediate |
Note: Win rates are approximate and based on trader consensus data. Individual results vary depending on execution, market conditions, and risk management discipline.
How to Trade Forex Breakouts Step-by-Step: The Complete Entry Framework
Understanding patterns is half the battle. The other half is knowing exactly when and how to enter. Let’s build a complete, repeatable entry framework.
Step 1 — Identify and Mark Your Key Level
Before you can trade a breakout, you need a level worth trading. Use the following process:
- Switch to the daily chart and mark any obvious support or resistance levels (horizontal lines at prior highs and lows).
- Identify chart patterns (triangles, wedges, flags) that have been forming for at least several days or weeks.
- Switch down to the 4-hour chart to refine your level placement and look for the same patterns at a smaller scale.
- Mark the exact levels where you expect a breakout — the top of a triangle, the resistance line of a flag, the boundary of a range.
Step 2 — Wait for the Breakout Candle to CLOSE
This is non-negotiable. Do not enter on an intra-candle break. Wait for the candle to close beyond the level. This single rule will filter out a massive proportion of fakeouts. It requires patience, but it will save your account repeatedly.
There are two entry approaches, each with trade-offs:
- Aggressive Entry (Breakout Close Entry): Enter as soon as the candle closes beyond the level. This gives you a better entry price but means you’ll sometimes enter before a fakeout is confirmed. Best for momentum breakouts with strong volume confirmation.
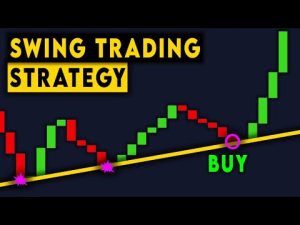
- Conservative Entry (Break & Retest Entry): Wait for price to break the level, pull back and retest it (former resistance should now act as support, and vice versa), and then show a rejection signal (like a pin bar or engulfing candle) before entering. This gives you a tighter stop loss and better confirmation, but you’ll occasionally miss trades that never retest.
For beginners learning how to trade forex breakouts successfully, the break and retest approach is strongly recommended. It reduces fakeout risk, improves your entry price, and naturally builds patience and discipline into your trading process.
Step 3 — Confirm with Multiple Factors
Before pulling the trigger, run through your confirmation checklist:
- Is this level significant on the higher timeframe? (Daily or 4-hour)
- Has the breakout candle closed decisively beyond the level?
- Is volume elevated above the recent average?
- Is this breakout in alignment with the higher-timeframe trend?
- Is this during a high-liquidity session (London or New York open)?
- Is there a clean pattern (triangle, flag, wedge) providing context?
If you can check 4 or more of these boxes, you have a high-quality breakout trade. If you can only check 2 or 3, skip the trade and wait for the next one.
Step 4 — Execute with Precision
Once you’ve confirmed the setup, execution should be mechanical, not emotional:
- Entry: At the close of the breakout candle, or on the pullback to the broken level.
- Stop Loss: Placed just inside the broken level (a few pips beyond the level, on the opposite side of your trade). If the breakout was from a triangle, stop goes just inside the triangle. If from a rectangle, stop goes just inside the range.
- Take Profit: Set at the next significant support or resistance level, or use the ‘measured move’ technique — project the height of the pattern from the breakout point.
Forex Breakout Strategy with Risk Management: Protecting Your Capital
Here’s the uncomfortable truth that most forex education glosses over: even the best forex breakout strategy will produce losing trades. Fakeouts happen. That’s the unavoidable reality. The difference between traders who survive and thrive long-term and those who blow their accounts isn’t the win rate — it’s the risk management framework they apply to every single trade.
The 1–2% Rule: Your Account’s Lifeline
Never risk more than 1–2% of your total trading capital on a single breakout trade. This might feel conservative, but consider the mathematics:
- At 1% risk per trade, you can lose 10 consecutive trades and still have 90% of your capital.
- At 5% risk per trade, 10 consecutive losses wipes out 40% of your account.
- At 10% risk per trade, a realistic but brutal drawdown of 15 consecutive losses effectively ends your trading career.
Breakout strategies inherently have periods of lower win rates when markets are choppy. The 1–2% rule ensures that these inevitable losing streaks don’t permanently damage your account.
Setting a Logical Stop Loss — Not a Convenient One
One of the biggest mistakes breakout traders make is setting their stop loss based on a monetary amount rather than a logical price level. Your stop loss should be placed at the point where your breakout thesis is clearly invalidated — i.e., where price re-entering the range proves the breakout has failed — not at some arbitrary distance chosen to match a preferred dollar amount.
Practical guidelines:
- For range breakouts: Stop just inside the opposite boundary of the range.
- For pattern breakouts (triangles, wedges): Stop just inside the pattern boundary.
- For break and retest entries: Stop just below/above the rejection candle.
- Always give the stop a small buffer of 5–10 pips to account for normal spread and volatility.
Risk-to-Reward: The Math That Makes You Profitable
Even with a win rate of just 40%, you can be profitable if your average winning trade is significantly larger than your average losing trade. This is the power of trading with a strong risk-to-reward ratio.
For breakout trading, aim for a minimum risk-to-reward ratio of 1:2, and target 1:3 or better on high-quality setups. Breakout trades — especially from well-formed patterns with extended consolidation — are capable of producing 1:4, 1:5, or even higher ratios when the market truly moves.
At a 1:3 risk-to-reward ratio, you only need to win 3 out of every 10 trades to break even. Win 4 out of 10, and you’re profitable. Win 5 out of 10, and you’re building genuine wealth.
Managing Open Trades: The Trailing Stop
Once your breakout trade is in profit and has reached your first target (ideally 1:1 or 1:1.5), consider:
- Moving your stop to breakeven: This locks in a risk-free trade. Even if price reverses, you don’t lose money.
- Using a trailing stop: As price continues in your favor, trail your stop behind significant swing lows (for long trades) or swing highs (for short trades) to lock in progressively more profit.
- Partial profit-taking: Close 50% of your position at the first target, move stop to breakeven, and let the remainder run toward a more ambitious target.
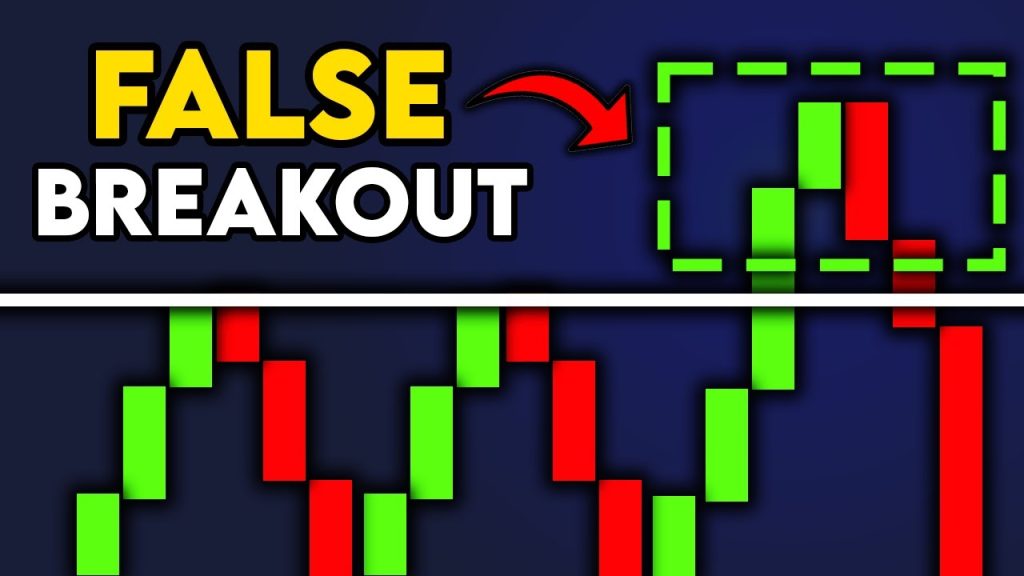
How to Avoid False Breakouts in Forex Trading: Protecting Yourself from the #1 Killer
We mentioned earlier that research suggests roughly 60–70% of apparent breakouts in forex turn out to be false signals. Let that sink in. The majority of breakout-like moves are traps. Understanding how fakeouts work — and how to avoid them — is non-negotiable.
Why False Breakouts Happen: The Institutional Trap

Large institutional players — banks, hedge funds, proprietary trading firms — cannot fill massive orders without moving the market against themselves. So they need counterparties. A classic technique is to push price just beyond a well-known support or resistance level, triggering clusters of stop-loss orders and breakout entries from retail traders. This creates a rush of orders in one direction, giving the institutions the liquidity they need to fill their positions in the opposite direction.
As noted by breakout experts at Equiti, in forex markets this type of liquidity hunting is particularly common around major technical levels and during low-liquidity windows, making timing and context critical filters.
6 Warning Signs of a Potential Fakeout
- Low volume on the break: If the breakout candle doesn’t show a meaningful volume surge, treat it with extreme suspicion.
- Occurring during the Asian session: Low liquidity makes it easy to push price through levels without real conviction.
- Wick penetration only: If price only poked through the level on a wick and closed back inside the range, it’s almost certainly a fakeout.
- No pattern context: A breakout from a ‘random’ level with no clear chart pattern formation behind it has a much lower probability of being genuine.
- Breaking against the higher-timeframe trend: Counter-trend breakouts have a significantly higher fakeout rate.
- Immediately following a large impulsive move: If price has already made a major move and is now ‘breaking out’ of exhausted levels, it may simply be reverting.
The Break and Retest: Your Best Defense
The single most effective fakeout filter is to wait for the retest. Here’s why: genuine breakouts establish the broken level as a new role (former resistance becomes new support). When price pulls back to test this newly established level and holds, it’s powerful confirmation that the breakout is real.
False breakouts, by contrast, almost never produce clean retests that hold. Price crashes back through the level and keeps going, leaving late breakout traders trapped.
By waiting for the retest, you are using the market itself to confirm or deny the breakout’s validity before you risk any capital. It’s patient, disciplined, and extraordinarily effective.
How to Trade Forex Breakouts for Beginners: Putting It All Together
If you’re new to forex and all of this feels like a lot to manage, take a breath. Let’s boil it down to a simple, repeatable process you can begin applying right now.
The Beginner’s Forex Breakout Strategy — 5 Simple Steps
- Step 1 — Choose your pairs: Start with major currency pairs like EUR/USD, GBP/USD, or USD/JPY. These have the highest liquidity, tightest spreads, and cleanest technical structures.
- Step 2 — Focus on two timeframes: The daily chart for identifying key levels and the 4-hour chart for finding patterns and confirming entries.
- Step 3 — Trade only break and retest setups: Until you have at least 3–6 months of consistent profitability, skip aggressive breakout entries. Only trade setups where price has broken, pulled back, and confirmed at the level.
- Step 4 — Risk no more than 1% per trade: Non-negotiable. This protects you during your learning curve.
- Step 5 — Keep a trading journal: Record every trade — entry, exit, reasoning, result. Review weekly. This is how you improve faster than 90% of traders.
Should You Consider Automated Breakout Systems?
One of the biggest challenges with breakout trading — and any trading strategy — is the psychological component. Watching price approach a key level and feeling the urge to jump in early. Seeing a trade move against you and panic-closing before the stop is hit. Watching a winning trade reverse and kicking yourself for not taking profit sooner.
These are human tendencies that are nearly impossible to completely eliminate through willpower alone. This is precisely why systematic, rule-based trading — and even automated trading — can be so valuable.
If you’re looking to remove emotion from your forex breakout strategy and execute with the consistency and discipline of a machine, it’s worth exploring tools like the VTM Automated Trading System. Purpose-built for forex traders, VTM Strategy’s automated system applies systematic, rules-based breakout logic to the market 24/5 — identifying qualified breakout setups, executing entries at the right moment, and managing risk with precision. For traders who struggle with the psychological side of breakout trading, an automated approach can be the missing piece that transforms inconsistent results into consistent performance.
Best Forex Breakout Indicators to Confirm Your Setups
Breakout trading is primarily a price action discipline, but the right technical indicators can add powerful confirmation filters. Here are the most effective ones:
1. Volume Indicator
Already mentioned, but worth repeating: volume is your most important confirmation tool. On MT4/MT5, the standard volume indicator works well. On TradingView, the Volume Profile and VWAP add additional insight into where institutional activity is concentrated.
2. Average True Range (ATR)
ATR measures the average volatility of a currency pair over a specific period. It’s invaluable for breakout trading in two ways: it helps you assess whether a breakout candle is unusually large (suggesting genuine momentum) and it helps you size your stop loss appropriately relative to the current market volatility.
3. Bollinger Bands
Bollinger Bands consist of a central moving average with two standard deviation bands above and below. When the bands contract (the ‘squeeze’), it indicates a period of low volatility — consolidation — which often precedes a powerful breakout. A close outside the bands following a squeeze is a strong forex breakout strategy signal.
4. RSI (Relative Strength Index)
RSI helps confirm momentum behind a breakout. A bullish breakout is more convincing when accompanied by RSI breaking above 50 and trending upward. Similarly, RSI divergence (price making a new high but RSI making a lower high) is a warning sign that a bullish breakout may be losing steam.
5. MACD (Moving Average Convergence Divergence)
MACD crossovers occurring in tandem with a price breakout add momentum confirmation. When the MACD line crosses above the signal line during a bullish breakout, it suggests building bullish momentum. It’s not a standalone trigger, but as a confirmation filter, it’s highly useful.
The Psychology of Breakout Trading: Why Discipline Beats Intelligence
Let’s talk about the elephant in the room. You can read every article ever written about forex breakout trading strategies and still lose money consistently if your psychology is working against you. Trading breakouts is psychologically demanding in specific ways.
FOMO — The Breakout Trader’s Greatest Enemy
FOMO (Fear of Missing Out) is particularly destructive in breakout trading because breakouts can move fast. You see price launching away from a level, and the panic sets in: “I’m missing it! I need to get in NOW!” So you chase the breakout, entering far from the level, with a wide stop, and often just in time to be caught in the inevitable pullback or reversal.
The antidote to FOMO is a pre-trade plan. Before price reaches your level, know exactly:
- What entry trigger you’re looking for
- Exactly where your stop loss will be placed
- Exactly where your take profit target is
- How large your position size will be
When your plan is written before the trade, you don’t need to make emotional decisions in the heat of the moment. You just execute.
Dealing with False Breakout Losses — The Inevitable Reality
Even the most disciplined, well-executed forex breakout strategy will produce losing trades. Fakeouts are a fact of life. The psychological mistake isn’t losing on a fakeout — it’s letting a series of fakeout losses convince you to abandon your strategy before it has a chance to prove itself over a statistically meaningful sample.
Accept that losses are the cost of doing business in trading. If your strategy has positive expectancy over 50+ trades, individual losing trades are simply part of the process. Track your trades, review your process, and focus on long-term statistics — not individual outcomes.
Best Times to Trade Forex Breakout Strategy for Maximum Results
Timing can make or break a breakout trade. Here’s a focused breakdown of when to be actively hunting setups:
- London Open (08:00–10:00 GMT): One of the most consistently productive periods for forex breakouts. European institutional orders flood the market, and price frequently breaks out of the Asian session range at this time. The London breakout strategy specifically exploits this phenomenon.
- New York Open (13:00–15:00 GMT): The second major liquidity event of the day. Particularly powerful when combined with economic data releases from the U.S., which can trigger explosive breakout moves on major pairs.
- Monday Breakouts: The gap between Friday’s close and Monday’s open often creates a fresh level, and price frequently makes a directional break early in the week. Worth watching closely for breakout setups.
- Avoid: Friday Afternoons and Asian Session Consolidation: Low liquidity creates choppy, unreliable price action prone to fakeouts. Unless you have a very specific catalyst, save your capital for higher-quality windows.
Frequently Asked Questions (FAQ): Forex Breakout Strategy
Q1: What is the best forex breakout strategy for beginners?
The break and retest strategy is widely considered the best starting point for beginner traders. It involves waiting for price to break a key level, pull back and confirm that level as new support/resistance, and then entering in the direction of the breakout. It filters out the majority of fakeouts and teaches patience and discipline from day one.
Q2: How do I know if a forex breakout is real or a fakeout?
The key filters are: (1) volume — genuine breakouts show a significant increase in trading volume; (2) candle close — wait for a candle to close beyond the level, not just poke through it; (3) timing — avoid breakouts during low-liquidity sessions; (4) trend alignment — trade breakouts in the direction of the higher-timeframe trend; and (5) retest confirmation — the broken level holds when retested.
Q3: What timeframe is best for forex breakout trading?
The daily and 4-hour charts are widely considered the most reliable timeframes for breakout trading. The daily chart provides the clearest, most significant levels and patterns, while the 4-hour chart allows for refined entries with tighter stop losses. Experienced traders sometimes use the 1-hour chart for entries, but beginners should stick to 4H/Daily.
Q4: How much risk should I take on each forex breakout trade?
Never risk more than 1–2% of your total trading capital on a single trade. This rule ensures that inevitable losing streaks — which every strategy experiences — don’t permanently damage your account. Consistent application of the 1–2% rule is what allows traders to survive long enough to let their edge play out over hundreds of trades.
Q5: Can I use an automated system for forex breakout trading?
Yes — and for many traders, automation is the key to removing emotional decision-making and achieving consistency. Systems like the VTM Automated Trading System are specifically designed to identify and execute breakout setups systematically, applying risk management rules with machine precision. For traders who struggle with emotional execution, automation can be transformative.
Q6: What is the success rate of forex breakout strategies?
Win rates for well-executed breakout strategies typically range from 45–65%, depending on the pattern, market conditions, and filters used. However, win rate alone is not what determines profitability — it’s the combination of win rate and risk-to-reward ratio. A strategy with a 45% win rate and a consistent 1:3 risk-to-reward ratio is highly profitable over the long term.
Q7: How important is volume in forex breakout trading?
Volume is critically important and is arguably the single most effective fakeout filter available to forex traders. A breakout candle that occurs on low volume is highly suspicious and should be treated with caution. When volume surges significantly on the breakout candle, it signals genuine institutional participation and dramatically increases the probability of a sustained move.
Conclusion: Your Forex Breakout Strategy Starts Right Now
Let’s bring everything full circle. The forex breakout strategy is not a get-rich-quick gimmick or a shortcut to overnight riches. It is a disciplined, logical, and proven approach to capturing some of the most powerful price moves the forex market produces. But like any edge, it only works when applied with consistency, patience, and iron-clad risk management.
Here’s what we’ve covered in this guide:
- Why breakout trading works and the psychology that drives it
- How to identify the highest-quality breakout setups using a 5-point confirmation checklist
- The best breakout chart patterns and how to trade each one
- A step-by-step entry framework for both aggressive and conservative traders
- Risk management principles that protect your capital through inevitable losing streaks
- How to identify and avoid false breakouts — the most costly trap in forex
- The indicators that best complement a price action breakout approach
- When to trade, when not to trade, and how to master the psychological challenges
The difference between the traders who fail and the traders who succeed at breakout trading is not intelligence or natural talent — it is discipline, process, and patience. Apply the framework in this guide consistently, track your results, review your performance, and refine your approach over time. The edge is there. Your job is to execute it.
And if you want to take your breakout trading to the next level with a systematic, automated approach that handles the execution for you — freeing you from the emotional rollercoaster of discretionary trading — explore what the VTM Automated Trading System has to offer. It could be the upgrade your trading has been waiting for.
The breakout is coming. Will you be ready for it?
Risk Disclaimer: Forex trading involves significant risk of loss. This article is for educational purposes only and does not constitute financial advice. Always trade with capital you can afford to lose and seek independent financial advice if necessary.