Forex Candlestick Patterns: 17 Powerful Patterns Most Traders Dangerously Ignore (Complete Guide)
Introduction: The Secret Language Most Forex Traders Never Learn
Picture this: you’re staring at your forex chart, price is moving, your gut says “buy” — but you have absolutely no idea why. Sound familiar? If it does, you’re not alone. Thousands of traders open positions every single day based on nothing more than hope, a hunch, or a half-understood indicator — and they wonder why they keep losing money.
Here’s the uncomfortable truth: the chart is talking to you, constantly. It has been since the day you opened your first demo account. The problem isn’t that the market is giving you bad signals — the problem is you haven’t learned its language yet. That language is called forex candlestick patterns, and once you understand it, trading will never feel the same again.
Candlestick charts were originally developed in 18th-century Japan by a rice merchant named Munehisa Homma, who discovered that tracking market psychology through price shapes gave him a massive edge. Centuries later, this exact same method is used by professional traders, hedge funds, and institutional desks around the world to decode the forex market in real time.
In this complete guide, you’re going to learn not just what the patterns look like — but why they work, how to trade them correctly, and how to avoid the most expensive mistakes beginners make when using them. Whether you’re just starting out or you’ve been trading for a while and still can’t seem to crack the code of price action trading, this post was written specifically for you.
Let’s break it down — pattern by pattern, concept by concept.

What Are Forex Candlestick Patterns? (And Why Should You Care)
Before we go deep, let’s make sure we’re standing on solid ground. A forex candlestick pattern is a specific formation on a price chart, made up of one or more candlesticks, that signals a likely future direction of price movement. These patterns are the cornerstone of price action trading — a method of reading the market without relying on lagging indicators.
The Anatomy of a Single Candlestick
Every candlestick on your forex chart is a story. It’s a snapshot of exactly what happened between buyers and sellers during a defined period of time — whether that’s one minute, one hour, or one day. Each candle has four key data points:
- Open Price — The price at which the period started
- Close Price — The price at which the period ended
- High — The highest price reached during the period
- Low — The lowest price reached during the period
The thick rectangular part of the candle is called the body. It represents the distance between the open and close. A green (or white) candlestick means the price closed higher than it opened — buyers won that round. A red (or black) candlestick means price closed lower than it opened — sellers were in control.
The thin lines above and below the body are called wicks (also known as shadows or tails). They show the extreme high and low points reached during that period, and they’re often more important than traders realize. A long upper wick, for example, tells you that buyers pushed price up aggressively — but sellers stepped in and rejected it back down. That’s critical information.
Why Candlestick Patterns Actually Work in Forex
Here’s the thing about candlestick patterns that makes them genuinely powerful: they don’t work because of magic or statistics alone — they work because they reflect human psychology. Fear, greed, hesitation, panic, and confidence all leave footprints on the chart, and candlestick patterns are how you read those footprints.
Candlestick analysis is critical in forex because currencies trade around the clock, five days a week, and price action dominates over fundamentals in the short term. Patterns like the Doji, Pin Bar, and Morning Star help identify turning points in major pairs like EUR/USD or GBP/JPY — and since the forex market is highly liquid, candlestick signals often appear cleaner with less noise than in other markets.
In short: learning forex candlestick patterns is one of the highest-leverage skills you can develop as a trader. And the good news? It’s not nearly as complicated as most people make it seem.
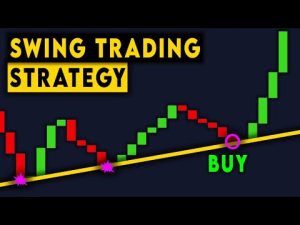
How to Read Candlestick Patterns in Forex Trading: The Fundamentals
Before you can identify any pattern, you need to master reading individual candles. Think of it like learning the alphabet before you read words. Here’s the process:
Step 1: Identify the Trend First
This is non-negotiable. Context is everything in candlestick patterns trading. A bullish reversal pattern only matters if it appears at the bottom of a downtrend. A bearish reversal signal is meaningless if price is already in a strong uptrend. Always zoom out first and identify:
- Is price in an uptrend? (Higher highs and higher lows)
- Is price in a downtrend? (Lower highs and lower lows)
- Is price ranging/consolidating? (Sideways movement between support and resistance)
The trend is your filter. Apply it every single time.
Step 2: Look for the Pattern at a Key Level
Candlestick patterns carry the most weight when they appear at significant price levels — areas where price has previously reacted. These include:
- Support zones — Areas where price has bounced up from before
- Resistance zones — Areas where price has reversed downward before
- Fibonacci retracement levels — Especially the 38.2%, 50%, and 61.8% levels
- Round numbers — Price tends to react around psychological levels like 1.2000, 1.3500, etc.
- Moving averages — The 50 EMA and 200 EMA frequently act as dynamic support/resistance
A candlestick pattern at a random area in the middle of a trend isn’t very meaningful. The same pattern forming right at a major support zone? That’s a completely different story.
Step 3: Wait for Confirmation
It isn’t wise to jump into a trade the moment you see a hammer or any other reversal pattern. Instead, you’ll want to wait to confirm the move. The simplest method of confirming a pattern is to see whether the anticipated direction continues in the next session. If it doesn’t, the signal has failed.
This is where most beginners lose money — they see a pattern and immediately fire off a trade. Patient traders wait for the candle to close (not just form) and often wait for the next candle to confirm direction before entering.
Step 4: Combine with One or Two Confirming Factors
Candlestick patterns work best when confirmed by:
- Volume (higher volume on confirmation candle = stronger signal)
- RSI divergence (momentum aligning with the pattern)
- MACD crossover (trend confirmation)
- Key support/resistance alignment
You don’t need ten indicators. Just one or two confirming factors dramatically increases the probability of a pattern playing out.
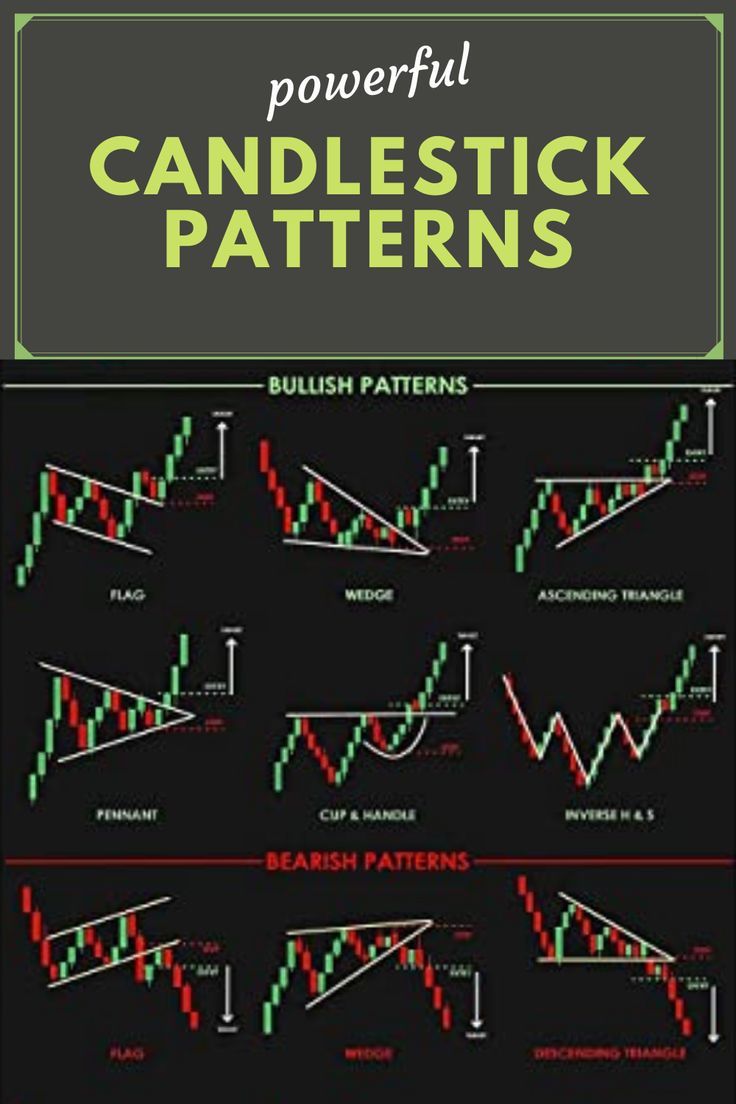
The 17 Most Powerful Forex Candlestick Patterns You Must Know
Now for the meat of this guide. We’re going to walk through the most reliable forex chart patterns, organized by category. Pay attention not just to what they look like, but to the psychology behind each one — that’s what will make them stick in your memory.
CATEGORY 1: SINGLE CANDLESTICK PATTERNS
1. The Doji — The Market’s Moment of Truth
The Doji is perhaps the most famous candlestick in all of forex chart patterns. It forms when the open and close prices are virtually equal, creating a candle with little to no body. What you’re looking at when you see a Doji is pure indecision — neither bulls nor bears could gain control during that period.
Types of Doji:
- Standard Doji — Tiny body with roughly equal upper and lower wicks
- Gravestone Doji — Long upper wick, almost no lower wick; signals bearish reversal after uptrend
- Dragonfly Doji — Long lower wick, almost no upper wick; signals bullish reversal after downtrend
- Long-Legged Doji — Very long wicks on both sides; extreme indecision and volatility
How to trade it: A Doji on its own is a warning signal, not a trade trigger. Wait for the next candle to confirm direction. A Gravestone Doji at the top of an uptrend followed by a bearish candle? That’s a high-probability short setup.
2. The Hammer — A Bullish Wake-Up Call
The Hammer has a small real body at the top of the candle’s range and a long lower shadow that is at least twice the length of the body, with little to no upper shadow. The psychology behind it is powerful: after a sell-off, bears push prices significantly lower during the period, but by the close, bulls aggressively step in and drive the price back up near the open — indicating the failure of selling pressure.
Where it works: Bottom of a downtrend, at key support levels.
Key characteristics:
- Long lower wick (at least 2x the body length)
- Small body at the top
- Little to no upper wick
- Color doesn’t matter much, but green is slightly more bullish
Trade setup: Enter on the open of the next candle after confirmation. Stop loss below the hammer’s low.
3. The Shooting Star — A Bearish Sniper’s Signal
The Shooting Star is the mirror image of the Hammer, appearing at the top of an uptrend. It has a small body at the bottom of the candle and a long upper wick — suggesting buyers pushed price up aggressively, but sellers completely overwhelmed them and drove price back down before the close.
Where it works: Top of an uptrend, at key resistance levels, often near Fibonacci levels.
Why it matters: The Shooting Star forms near resistance levels at the end of an uptrend, signaling that the bullish momentum is exhausted and a reversal is likely incoming.
4. The Spinning Top — Quiet Indecision
A Spinning Top has a small body (either bullish or bearish) with upper and lower wicks that are roughly equal. Like the Doji, it signals indecision in the market — but with slightly more conviction in one direction. On its own it means little, but after a strong trend it can foreshadow a reversal.
5. The Marubozu — A Candle With No Excuses
The Marubozu is a candle with no wicks at all — the open is the low (for bullish) or the high is the open (for bearish). It represents absolute conviction. A Bullish Marubozu means buyers were in complete control from open to close with zero pushback. This is one of the strongest momentum signals you’ll find on any forex chart.
CATEGORY 2: TWO-CANDLE PATTERNS
6. The Bullish Engulfing Pattern — When Bulls Devour Bears
This is one of the most reliable candlestick patterns for trading in forex. It forms when a small bearish (red) candle is followed by a larger bullish (green) candle that completely engulfs the body of the previous candle.
The psychology: Sellers drove price down on the first candle. But on the second candle, buyers came in with such overwhelming force that they not only recovered all those losses — they pushed even higher, completely swallowing the previous candle.
Where it works best: Bottom of a downtrend, at key support zones.
Trade setup:
- Enter at the open of the third candle (after confirmation)
- Stop loss below the low of the engulfing candle
- Target: previous resistance zone
Bullish engulfing and bearish engulfing patterns are among the best candlestick patterns for day trading in the forex market. You need to learn to recognize these patterns if you really want to have a consistent day trading experience.
7. The Bearish Engulfing Pattern — When Bears Take Over
The opposite of the Bullish Engulfing. A small green candle followed by a larger red candle that completely engulfs it. This signals that sellers have overwhelmed buyers and a downside move is likely.

Where it works best: Top of an uptrend, at key resistance zones.
The Bearish Engulfing pattern occurs when a smaller green candlestick is followed by a larger red candlestick that completely engulfs the previous candle — a strong indication that sellers have seized control of the market.
8. The Bullish Harami — Spotting a Pause in the Selling
The Harami (Japanese for “pregnant”) forms when a small candle is completely contained within the body of the previous larger candle. A Bullish Harami appears during a downtrend — a large bearish candle is followed by a smaller bullish candle whose body fits entirely inside the prior candle’s body.
The Harami candle tells us that the market is in an indecision period. It signals the potential slowing down of the prevailing trend, though confirmation is essential before acting.
Trade tip: The Bullish Harami is more of a caution signal than an aggressive buy signal. Wait for the third candle to break above the first candle’s high before entering.
9. The Bearish Harami — The Trend May Be Weakening
The bearish version forms at the top of an uptrend. A large bullish candle is followed by a smaller bearish candle contained within it. It warns that bullish momentum is fading — but like its counterpart, always wait for confirmation.
10. The Tweezer Tops and Bottoms — Precision Reversal Signals
Tweezer Tops form when two candles have identical (or very similar) highs at the top of an uptrend. Tweezer Bottoms form when two candles have identical lows at the bottom of a downtrend.
These patterns signal that the market tested a specific price level twice and failed to break through — a clear rejection. They work exceptionally well when they form exactly at a key resistance or support level.
CATEGORY 3: THREE-CANDLE PATTERNS
11. The Morning Star — Dawn After the Darkness
The Morning Star is a commonly used triple-session candlestick pattern that offers an indication that a downtrend might be about to end with an impending reversal. It begins with the downtrend intact, shown by a long red candle. The second candle indicates indecision — which could be a sign that a reversal is on the cards. Then, the long green third candle confirms that the reversal is underway. If the second candle is a Doji, the chances of a successful reversal increase significantly.
The Morning Star is one of the highest-probability bullish candlestick patterns in all of forex trading. Three candles. Three chapters of a story: selling exhaustion, indecision, and a bullish takeover.
Trade setup:
- Confirm the third candle closes well into the body of the first candle
- Enter at the close of the third candle or open of the fourth
- Stop below the second candle’s low
12. The Evening Star — Dusk Before the Drop
The exact opposite of the Morning Star — appearing at the top of an uptrend. A large green candle, followed by a small-bodied indecision candle (often a Doji), followed by a large red candle that moves well into the body of the first candle.
This is a premium bearish reversal signal, particularly when it appears at a strong resistance zone or after a prolonged uptrend.
13. The Three White Soldiers — Full Bullish Commitment
Three consecutive strong bullish candles, each opening within the previous candle’s body and closing progressively higher. This is one of the most powerful continuation or reversal signals in uptrend scenarios.
What it tells you: Buyers are completely in control — there’s strong, sustained demand entering the market over three consecutive sessions. When this pattern follows a prolonged downtrend, it can signal a powerful trend reversal.
14. The Three Black Crows — A Bearish Onslaught
Three consecutive strong bearish candles, each opening within the previous candle’s body and closing progressively lower. The mirror image of Three White Soldiers — and equally powerful as a bearish signal after an uptrend.
Caution: When Three Black Crows appear after a very extended downtrend, it can sometimes indicate overselling rather than continued decline. Context and key levels matter.
15. The Abandoned Baby — Rare but Devastating
One of the rarest patterns in forex candlestick patterns trading, the Abandoned Baby consists of a strong trending candle, followed by a Doji that gaps away from the first candle, followed by a strong candle in the opposite direction that also gaps away from the Doji.
The isolation of the middle Doji (the “abandoned baby”) signals complete trend exhaustion and a high-probability reversal. Because forex markets rarely gap, this pattern is more common on daily timeframes.
CATEGORY 4: CONTINUATION PATTERNS
16. Rising and Falling Three Methods — The Trend Pausing to Breathe
The Rising Three Methods consists of a long bullish candle, followed by three small bearish candles that remain contained within the first candle’s range, followed by a final strong bullish candle that closes above the first candle’s high.
The psychology behind the Rising Three Methods is clear: the uptrend is intact. The small bearish candles in the middle represent a minor pause where sellers are too weak to reverse the trend. The final bullish candle confirms the resumption of buying pressure.
The Falling Three Methods is the bearish version — and works equally well in downtrending markets.
17. The Pin Bar (Inside Bar) — The Market’s Rejection Stamp
While technically a variation of the Hammer/Shooting Star family, the Pin Bar deserves its own mention because it’s the single most popular pattern among professional price action traders.
A Pin Bar has:
- A very small body
- A very long wick (the “pin”) in one direction
- A short or absent wick on the other side
The long wick is a rejection wick — price was pushed strongly in one direction, but then completely rejected and snapped back. Pin bars at key levels are among the cleanest, most reliable setups available in forex.
Forex Candlestick Patterns Comparison Table
Here is a quick-reference table of the most important patterns, their type, reliability, and best use case:
| Pattern | Type | Signal | Reliability | Best Timeframe | Best Location |
|---|---|---|---|---|---|
| Doji | Single | Indecision / Reversal | Moderate | H4, Daily | Top/bottom of trends |
| Hammer | Single | Bullish Reversal | High | H1, H4, Daily | Bottom of downtrend, support |
| Shooting Star | Single | Bearish Reversal | High | H1, H4, Daily | Top of uptrend, resistance |
| Marubozu | Single | Strong Momentum | High | Any | After breakout |
| Bullish Engulfing | Two-candle | Bullish Reversal | Very High | H4, Daily | Bottom of downtrend |
| Bearish Engulfing | Two-candle | Bearish Reversal | Very High | H4, Daily | Top of uptrend |
| Bullish Harami | Two-candle | Reversal Warning | Moderate | H4, Daily | Bottom of downtrend |
| Bearish Harami | Two-candle | Reversal Warning | Moderate | H4, Daily | Top of uptrend |
| Tweezer Tops | Two-candle | Bearish Reversal | High | H4, Daily | Key resistance |
| Tweezer Bottoms | Two-candle | Bullish Reversal | High | H4, Daily | Key support |
| Morning Star | Three-candle | Bullish Reversal | Very High | H4, Daily | Bottom of downtrend |
| Evening Star | Three-candle | Bearish Reversal | Very High | H4, Daily | Top of uptrend |
| Three White Soldiers | Three-candle | Bullish (Cont./Rev.) | High | Daily, Weekly | After downtrend or consolidation |
| Three Black Crows | Three-candle | Bearish (Cont./Rev.) | High | Daily, Weekly | After uptrend or consolidation |
| Abandoned Baby | Three-candle | Strong Reversal | Very High | Daily | Extremes of major trends |
| Rising Three Methods | Five-candle | Bullish Continuation | High | Daily | Middle of uptrend |
| Pin Bar | Single | Reversal/Rejection | Very High | H1, H4, Daily | Key support/resistance |
How to Identify Bullish and Bearish Candlestick Patterns in Forex: A Practical Framework
Understanding individual patterns is one thing. Using them consistently in live trading is another. Here’s a practical, step-by-step framework you can apply to any forex chart:
The 5-Step Pattern Identification Process
Step 1: Open Your Chart and Set Your Timeframe
Start with the Daily chart to understand the big picture trend. Then zoom into the H4 (4-hour) chart for entry-level context. Finally, drop to the H1 (1-hour) or M30 (30-minute) chart for precise entry timing. This is called top-down analysis and it’s used by most professional price action traders.
Step 2: Mark Your Key Levels
Before looking for any pattern, identify:
- Major support zones (previous lows that held)
- Major resistance zones (previous highs that were rejected)
- Obvious trend lines
- Fibonacci levels (if applicable)
Step 3: Look for Pattern Formation at Those Levels
Now watch for one of the 17 patterns we covered above to form at one of your marked levels. The more precise the pattern forms at the level (especially if multiple patterns align — e.g., a Pin Bar forming inside a Morning Star at key support), the higher the probability.
Step 4: Wait for the Candle to CLOSE
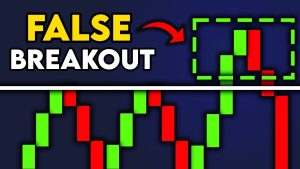
Never trade a pattern that hasn’t finished forming. A candle that looks like a Shooting Star with 20 minutes left in the period can turn into a completely different candle by the close. Wait. This discipline alone will save you from dozens of false entries.

Step 5: Confirm and Execute
Look for one confirmation factor (RSI below 30 for bullish signals, above 70 for bearish; MACD cross; volume spike). Then enter your trade with a clearly defined:
- Entry price (usually the open of the next candle after confirmation)
- Stop loss (usually beyond the pattern’s high or low)
- Take profit (usually the next major support/resistance level)
The Best Candlestick Patterns for Forex Trading Success: Pro Tips
You now know the patterns. But knowing them and profiting from them are two very different things. Here are the pro-level insights that separate consistently profitable traders from the rest:
Tip 1: Higher Timeframe Patterns Are More Reliable
A Bullish Engulfing on a 1-minute chart is almost meaningless. The same pattern on a Daily chart is a significant signal. The higher the timeframe, the more participants contributed to forming that candle, and the more meaningful the resulting pattern. Beginners should focus on H4 and Daily charts until they build pattern recognition skills.
Tip 2: Confluence Is King
The best trades happen when multiple factors align simultaneously. For example:
- Price is at a major support zone (Level)
- A Morning Star forms over three days (Pattern)
- RSI shows bullish divergence (Indicator)
- The trend on the Weekly chart is bullish (Higher Timeframe)
When all four align? That’s a high-conviction setup. Trade it with appropriate size. This multi-confluence approach is well documented in Investopedia’s technical analysis framework and is standard practice among professional traders.
Tip 3: Manage the Trade, Not Just the Entry
Most trading education focuses on entry. But the real edge comes from how you manage the trade once you’re in. Consider:
- Moving your stop loss to breakeven once price moves in your favor by 1:1 R/R
- Scaling out partial profits at key levels
- Letting remaining position run toward major targets with trailing stop
Tip 4: Keep a Pattern Journal
This might sound old-fashioned, but documenting every pattern trade you take — including the setup, entry, outcome, and lessons — is one of the fastest ways to improve. Over time, you’ll start to notice which patterns work best in which pairs and which market conditions.
Tip 5: Avoid These Common Mistakes
- Trading patterns without trend context — A bearish pattern in a strong uptrend is low probability
- Entering before candle close — The pattern may change
- Using patterns in very low-liquidity conditions — Weekend sessions or thin holiday markets produce unreliable patterns
- Ignoring the bigger picture — A pattern on H1 contradicting the Daily trend is high-risk
Price Action Trading: How Candlestick Patterns Fit the Big Picture
Candlestick patterns don’t exist in a vacuum — they’re one tool within the broader discipline of price action trading. Price action traders strip away most indicators and focus on reading raw price movement on the chart: support, resistance, trend structure, and candlestick patterns.
Candlestick patterns fall under the umbrella of technical analysis — evaluating price action to predict future movements. Specifically, candlestick charts display the open, high, low, and closing prices for a trading period, which could be a minute, hour, day, or week timeframe.
The beauty of price action trading is its simplicity. When you combine candlestick patterns with:
- Support and resistance levels (horizontal zones)
- Trend lines and channels (diagonal structure)
- Market structure (higher highs/higher lows vs. lower highs/lower lows)
- Volume analysis (confirming the strength of moves)
…you have a complete, self-sufficient trading system that doesn’t rely on slow indicators or complex mathematical models.
Want to Go Further? Let Automation Do the Heavy Lifting
Reading candlestick patterns manually takes time, practice, and focus. But what if you could have a system that monitors the market for you, identifies high-probability setups automatically, and signals you when to act?
That’s exactly what the VTM Automated Trading System is designed for. Built on proven price action and candlestick pattern principles, the VTM system handles pattern identification, confluence confirmation, and trade signaling — so you can focus on execution rather than spending hours in front of charts hunting for setups. Whether you’re a full-time trader or someone who trades around a busy schedule, automation can be the game-changer that brings consistency to your trading. Visit vtmstrategy.com to learn more.
Frequently Asked Questions (FAQ)
Q1: What is the most reliable candlestick pattern in forex?
The Bullish Engulfing, Bearish Engulfing, Morning Star, and Evening Star patterns are consistently ranked among the most reliable, particularly when they appear on H4 and Daily timeframes at key support or resistance zones. According to research, Morning Star and Evening Star patterns show accuracy rates above 70% when confirmed with support or resistance zones.
Q2: Do candlestick patterns work in forex for beginners?
Absolutely — in fact, candlestick patterns are one of the best starting points for beginners because they are visual, intuitive, and built on market psychology. Start with just 3–5 patterns (Hammer, Shooting Star, Engulfing, Pin Bar, Doji) and master those before expanding your repertoire.
Q3: What timeframe is best for candlestick patterns in forex?
For the cleanest, most reliable signals, the H4 (4-hour) and Daily charts are recommended. These timeframes filter out the noise found on lower charts and produce patterns that carry more weight because more market participants contributed to forming them.
Q4: Can candlestick patterns be used alone?
While candlestick patterns aren’t perfect indicators on their own, they provide excellent insights into market direction. The strongest trading setups occur when multiple factors align — candlestick patterns combined with technical tools such as moving averages, Fibonacci retracements, or trendlines significantly increase the probability of success.
Q5: What’s the difference between reversal and continuation patterns?
- Reversal patterns (Hammer, Morning Star, Engulfing) signal that the current trend is about to change direction.
- Continuation patterns (Rising Three Methods, Three White Soldiers mid-trend) signal that the current trend will resume after a brief pause.
Understanding which type of pattern you’re looking at fundamentally changes how you manage the trade.
Q6: How long does it take to learn forex candlestick patterns?
With consistent study and practice on a demo account, most traders can recognize and correctly interpret the core patterns within 4–8 weeks. However, developing the discipline to wait for confirmation, manage trades properly, and apply patterns in context takes longer — usually 3–6 months of deliberate practice.
Q7: Are forex candlestick patterns the same as stock candlestick patterns?
Yes. Candlestick patterns are used across multiple asset classes including equities, forex, cryptocurrencies, and derivatives. They work because price action reflects trader psychology, which is consistent across all markets.
Conclusion: Start Reading the Market’s Language Today
You’ve just absorbed what most forex traders never take the time to learn properly. From the basic anatomy of a single candle to the 17 most powerful forex candlestick patterns, from the 5-step identification process to the pro tips that separate consistent traders from the crowd — you now have everything you need to start reading price action with real competence.
But here’s the part that matters most: knowledge without action is just trivia. Pull up a chart right now. Look for the Daily trend. Mark your key levels. Watch for a pattern to form. Then practice the discipline of waiting for confirmation before you do anything.
Don’t be the trader who reads about candlestick patterns and then goes back to randomly buying and selling. Don’t be the person who spends years in the market without ever learning the language it speaks. The patterns are there, on every chart, on every pair, every single day. The question is simply whether you’ll learn to see them.
Start today. Your future self as a trader will thank you.
Ready to take your trading to the next level with automated candlestick pattern detection and signal generation? Visit vtmstrategy.com and discover how the VTM system can transform your approach to the forex market.