Understanding Top-Down Analysis in Forex Trading
Understanding top-down analysis in forex trading is one of the most powerful yet consistently overlooked skills a trader can develop. While most retail traders jump straight into lower-timeframe charts looking for quick setups, professional and institutional traders take a completely different approach; they start from the higher timeframe and work their way down to lower timeframes.
What is top-down analysis?
Top-down analysis is simply the process of analyzing a forex chart by first observing how the market is behaving on higher timeframes, then gradually narrowing your focus down to lower timeframes to find precise trade entries. This strategy gives you a bird’s-eye view of the general market conditions before you ever consider placing a trade.
If you have been struggling with inconsistent results, getting stopped out repeatedly, or entering trades that seem good but quickly reverse there is a strong chance you are missing the bigger picture. Top-down analysis solves exactly that problem.

At its core, top-down analysis in forex trading is a structured, multi-timeframe methodology. Instead of looking at a single timeframe in isolation, traders begin their analysis on the highest timeframes typically the Monthly or Weekly chart, and progressively drill down through Daily, 4-Hour, 1-Hour, and finally the lower timeframes like the 15-minute or 5-minute chart for entries.
Think of it like zooming in on a map. Before navigating a new city, you first look at the country map to understand the broad direction, then the regional map to understand roads and landmarks, and finally the street view to find the exact turn you need to make. Forex trading works in exactly the same way.
The key principle behind top-down analysis is this: higher timeframes always have more authority than lower timeframes. A support level on the Weekly chart carries far more weight than a support level on the 15-minute chart. Understanding this hierarchy is what separates consistently profitable traders from those who struggle.
Why Most Traders Overlook Top-Down Analysis
Despite being one of the most effective forex strategies available, top-down analysis is frequently ignored and for understandable reasons.
It requires patience. Most traders, especially beginners, are attracted to fast-moving lower timeframe charts. The 1-minute and 5-minute charts feel exciting, active, and full of opportunities. Higher timeframes like the Weekly or Monthly can feel slow and boring by comparison.
It takes more time upfront. Analyzing four to five timeframes before entering a trade demands more preparation than simply glancing at a single chart and pressing buy or sell.
It challenges impulsive trading habits. Top-down analysis forces you to wait for alignment across timeframes before acting. For traders addicted to the thrill of constant trading, this discipline can feel restrictive.
However, the traders who embrace this approach consistently report fewer losing trades, better risk management, and trades that move significantly in their favor because they are working with the market rather than against it.
The Top-Down Analysis Framework: Step by Step
Understanding top-down analysis in forex trading becomes much easier when you break it into a clear, repeatable process.
Step 1: Start With the Monthly Chart
Begin by opening the Monthly chart for your chosen currency pair. At this level, you are not looking for trade entries. You are simply identifying:
The overall trend direction – is price broadly moving up, down, or ranging?
Major structural levels – key highs, lows, and zones where price has historically reversed
Long-term momentum – is the market accelerating, decelerating, or consolidating?
The Monthly chart tells you the story of the market over years. It filters out all the noise and gives you the clearest picture of where price fundamentally wants to go.
Step 2: Analyze the Weekly Chart
Move down to the Weekly chart and begin to refine your analysis. Here you are looking for:
Confirmation of the monthly trend – does the weekly movement align with the broader direction?
Intermediate support and resistance zones – areas where price has spent significant time or reacted strongly
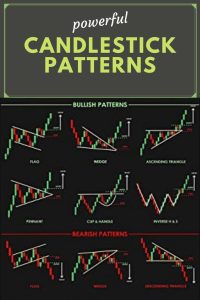
Candlestick patterns and price action signals – weekly patterns carry enormous significance

A bullish setup on the weekly that aligns with a bullish monthly trend is far more powerful than a bullish signal on the weekly that contradicts the monthly direction.
Step 3: Review the Daily Chart
The Daily chart is where most professional traders spend the majority of their planning time. It provides the best balance between context and detail. On the Daily, you are identifying:
Short-to-medium term trend structure, the sequence of higher highs and higher lows (bullish) or lower highs and lower lows (bearish)
Key daily levels; support, resistance, and supply and demand zones
Potential trade setups forming patterns, consolidations, or pullbacks to important levels
By the time you reach the Daily chart, you should have a strong directional bias built from the Monthly and Weekly analysis.
Step 4: Zoom Into the 4-Hour and 1-Hour Charts
These intermediate timeframes help you time your trade with greater precision. On the 4-Hour and 1-Hour charts, you are looking for:
Entry trigger zones – where exactly within the Daily level does price show signs of reversing or continuing?
Confirmation signals – candlestick patterns, momentum shifts, or break-and-retest structures
Stop loss placement zones – logical levels where your trade idea would be invalidated
Step 5: Execute on the Lower Timeframes (Optional)
For traders who prefer tighter entries and smaller stop losses, the 15-minute or 5-minute chart can be used purely for execution. At this stage, your analysis is already complete – you are simply waiting for price to arrive at your identified zone and confirm the setup.
This is a critical point: you are not analyzing the market on lower timeframes, you are only executing a plan that was built on higher timeframes.
How Top-Down Analysis Improves Your Trading
Understanding top-down analysis in forex trading transforms the way you interact with the market in several important ways.
It gives you context. Every price movement means more when you know where it sits within the bigger picture. A bearish candle on the 5-minute chart looks alarming in isolation, but completely normal when you know price is simply pulling back to a Daily support level within a weekly uptrend.
It filters out low-quality trades. When you require alignment across multiple timeframes before entering, you naturally eliminate many marginal or counter-trend setups that would otherwise result in losses.
It improves your risk-to-reward ratios. Higher timeframe levels tend to produce larger moves when price reacts. Trading with the higher timeframe context means you are positioning yourself to capture larger portions of those moves.
It builds trading confidence. There is a significant psychological difference between entering a trade impulsively on a 5-minute chart and entering a trade that aligns with the Monthly, Weekly, and Daily direction. Conviction in your analysis reduces emotional decision-making.
Common Mistakes When Applying Top-Down Analysis
Even traders who understand the concept of top-down analysis often make critical errors in its application.
Mistake 1: Starting the analysis from the wrong timeframe. Many traders begin on the 1-hour or 4-hour chart and then look at the Daily to “confirm.” This is bottom-up thinking disguised as top-down analysis. Always begin at the highest timeframe first.
Mistake 2: Ignoring conflicting signals on higher timeframes. If the Weekly chart shows strong bearish momentum but you want to take a bullish trade on the 1-hour chart, you are fighting the tide. Conflicting higher timeframe signals should reduce your position size or keep you out of the trade entirely.

Mistake 3: Over-analyzing. Some traders apply top-down analysis across seven or eight timeframes and end up paralyzed by conflicting information. Sticking to three to four timeframes – typically Monthly/Weekly for bias, Daily for setup, and 4H/1H for entry is sufficient for most trading approaches.
Mistake 4: Abandoning the process when impatient. Top-down analysis will sometimes keep you out of the market for days or even weeks while you wait for price to align on multiple timeframes. This waiting is not inactivity, it is discipline, and it is what protects your capital.
Practical Example: Applying Top-Down Analysis on EUR/USD
To make understanding top-down analysis in forex trading more concrete, consider a simplified example using EUR/USD.
Monthly Chart: Price has been in a broad uptrend for the past several months and is currently pulling back toward a major monthly support zone around a historical level.
Weekly Chart: The pullback has brought price to a weekly demand zone. The previous weekly candle closed as a bullish pin bar, showing rejection of lower prices.
Daily Chart: Price is consolidating just above the weekly demand zone. A small inside bar pattern has formed, indicating compression before a potential move.
4-Hour Chart: A break of the inside bar to the upside occurs, with price retesting the breakout level.
1-Hour Chart (Entry): A bullish engulfing candle forms on the retest, offering a precise entry point with a stop loss below the weekly demand zone and a target toward the next significant resistance level.
Every timeframe in this example is telling the same story: the market wants to go higher, and price has given you a logical, well-defined entry. That is the power of top-down analysis.
Top-Down Analysis and Risk Management
One often-overlooked benefit of top-down analysis is how naturally it complements sound risk management. Because your stop losses are placed at levels validated across multiple timeframes, they are structurally logical rather than arbitrary.
Your targets, too, are determined by higher timeframe resistance and support zones — meaning you are aiming for levels that matter to the entire market, not just to your specific entry timeframe.
A good rule of thumb when applying top-down analysis is to aim for a minimum risk-to-reward ratio of 1:2 or higher. Since you are entering at key structural levels identified on higher timeframes, price typically has room to move significantly in your direction before reaching the next obstacle.
Conclusion
Understanding top-down analysis in forex trading is not a complicated concept, but it requires discipline, patience, and a willingness to invest time in preparation before ever clicking a buy or sell button.
By starting on the Monthly chart and working your way down through the Weekly, Daily, and intraday timeframes, you align yourself with the dominant market forces rather than fighting them. You gain context, confidence, and clarity that traders who ignore higher timeframes simply do not have.
Top-down analysis will not make every trade a winner, nothing will. But it will dramatically improve the quality of the setups you take, the logic behind your risk management, and ultimately your consistency as a forex trader.
Start your next trading session by opening the Monthly chart first. Build your analysis from the top down. Give yourself the bird’s-eye view of the market that most traders never bother to seek and let that be the edge that separates your trading from the crowd.