Simple Chart Analysis : 7 Simple Steps Most Traders Get Wrong When Analyzing Any Forex Chart
Introduction: Why Learning Simple Steps to Analyze Any Chart Changes Everything
Most traders do not lose money because the market is too difficult. They lose money because they never truly learn how to read a chart properly. This is a hard truth that many people avoid confronting. You can spend years jumping from one strategy to another, buying indicators, watching endless YouTube videos, and still struggle if you do not master the core skill that sits at the center of all successful trading, proper chart analysis.
When people hear terms like chart analysis, forex chart analysis, or technical analysis trading, they often assume it is something complex that only professionals can understand. In reality, the market rewards simplicity far more than complexity. Price moves for clear reasons, and those reasons are visible on the chart if you know what to look for. The problem is that most traders skip the fundamentals and rush into advanced tools before they understand the basics.

This is why learning simple steps to analyze any chart is so powerful. It removes confusion and replaces guesswork with clarity. Instead of reacting emotionally to every candle, you begin to understand why price is moving, where it is likely to react, and when it is better to stay out of the market completely. This shift alone can save traders thousands of dollars over time.
For beginners, chart analysis can feel intimidating. Charts seem fast, unpredictable, and full of conflicting signals. For intermediate traders, the challenge is different. They often overanalyze, stacking indicators and patterns until they no longer trust what they see. In both cases, the root problem is the same. They do not follow a structured approach to analyzing charts step by step.
This guide is designed to fix that problem. It breaks down how to analyze forex charts step by step in a way that feels logical, practical, and easy to apply. These are not theoretical ideas. They are the same principles used by experienced traders to stay consistent and disciplined over the long term. More importantly, these steps help you avoid the common mistakes that silently destroy trading accounts, such as emotional overtrading, chasing price, and ignoring market context.
Another reason chart analysis matters so much is that it directly impacts your confidence. When you understand trading chart patterns, trend direction, and key price levels, you stop feeling lost. You no longer enter trades out of fear of missing out or exit too early because of doubt. Instead, your decisions are based on structure and logic, not emotion.
This article focuses on seven powerful steps that most traders get wrong when analyzing any forex chart. Each step builds on the previous one, creating a complete framework you can rely on regardless of market conditions. Whether you are new to trading or trying to fix long standing mistakes, these steps will help you see the market more clearly and trade with purpose.
If you are tired of guessing, tired of inconsistent results, and tired of feeling like the market is always one step ahead of you, then mastering chart analysis is not optional. It is the skill that separates hopeful traders from consistently profitable ones.
Step 1: Know Your Chart Types and What They Reveal
Charts are the foundation of technical analysis trading. Before you analyze anything, you must first understand what kind of chart you are looking at and what it tells you.
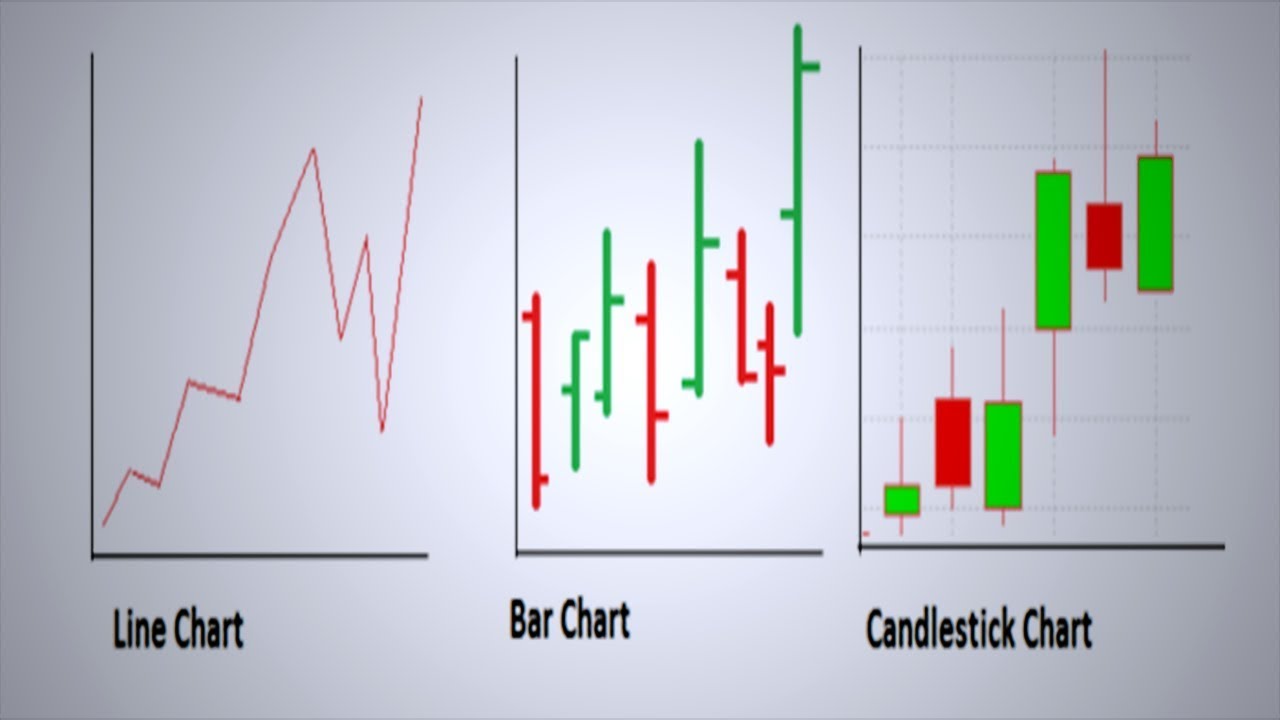
The most common chart types are:
- Line Chart – Connects one data point per bar (usually closing price). Useful for understanding general trends.
- Bar Chart (OHLC) – Shows open, high, low, and close for each time period. This is useful for deeper price interpretation. (Wikipedia)
- Candlestick Chart – The most popular form of forex chart analysis because it visually shows price action with “bodies” and “wicks”. (Wikipedia)
Each chart type has its advantages, but for most traders, candlestick charts offer immediate understanding of market sentiment due to their visual clarity.
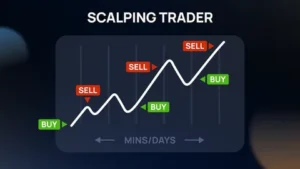
Step 2: Determine Your Time Frame Based on Your Trading Style
Watch the practical course on youtube
One of the most misunderstood aspects of how to analyze forex charts step by step is the choice of timeframe.
- Scalpers use 1-minute or 5-minute charts
- Day traders might prefer 15-minute to 1-hour charts
- Swing traders often use 4-hour or daily charts
- Position traders and investors analyze weekly or monthly charts
The key is aligning your timeframe with your trading goals. A day trader looking at a weekly chart will miss short term entries, and a position trader trying to make decisions on a 1-minute chart will be overwhelmed.
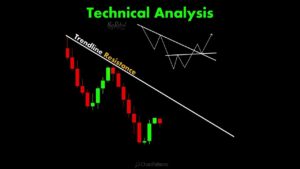
Step 3: Identify Trend Direction With Clarity
Correctly identifying the trend is one of the most important parts of chart analysis.
Ask yourself:
- Is the market making higher highs and higher lows? That indicates an uptrend.
- Is it creating lower lows and lower highs? That suggests a downtrend.
- Is price moving sideways? That means the market is ranging.
This simple categorization allows you to avoid trading against the dominant trend — one of the most common mistakes traders make.
Step 4: Spot Support and Resistance Like a Pro
Support and resistance are areas where prices have historically bounced or reversed.
- Support: A level where buying pressure outweighs selling.
- Resistance: A zone where selling pressure overpowers buyers.
These lines are not random. They reflect areas where many traders have placed stops, take profits, and decision points. Accurate identification of support and resistance allows you to anticipate where price might react next, making your technical analysis significantly more precise.
Step 5: Recognize Key Trading Chart Patterns
The art of spotting trading chart patterns gives traders the edge to predict possible future price behavior.
Here are some common patterns:
| Pattern | Meaning | Typical Use |
|---|---|---|
| Double Top / Bottom | Reversal signal | Indicates switch in trend |
| Head and Shoulders | Strong reversal | Bullish to bearish or vice versa |
| Triangles (ascending, descending, symmetrical) | Continuation patterns | Helps anticipate breakouts |
| Cup and Handle | Bullish continuation pattern | Used for trend continuation setups (Wikipedia) |
Chart patterns are not crystal balls, but they shape chart analysis for beginners and seasoned pros by showing potential high probability scenarios.
Step 6: Include Indicators Only as Confirmation — Not As Primary Signals
Many traders mess up by relying too heavily on indicators. What you want to avoid is becoming overly dependent on them. Technical indicators can help you confirm a move, but they should never replace your judgment.
For example:
- MACD helps identify trend momentum but lags behind price action. (Investopedia)
- Stochastic Oscillator can suggest overbought or oversold conditions, but should work with price structure. (Investopedia)
Remember, price is king. Indicators should help confirm, not dictate, your trade decisions.
Step 7: Manage Emotions and Avoid Overtrading through Discipline
This is one of the most overlooked aspects in chart analysis for beginners — emotional discipline.
Even if you have perfect analysis knowledge, emotional responses like fear or greed can ruin your trading results. Overtrading, revenge trading, and impulsive exits can destroy accounts.
Here are some discipline techniques:
- Plan every trade before you enter
- Set clear stop-loss and take-profit orders
- Avoid trading after losses to “recover” quickly
- Review trades rather than react emotionally
Emotional discipline is a critical part of successful trading and separates consistent traders from those who struggle.
Summary
Mastering chart analysis is the foundation of successful trading, yet it remains one of the most misunderstood skills among forex traders. Many traders lose money not because the market is impossible to predict, but because they approach charts without structure, clarity, or discipline. This article emphasizes that learning simple steps to analyze any chart is far more effective than relying on complex indicators or chasing so called secret strategies. When traders understand what price is communicating, they stop reacting emotionally and start making informed decisions.
Watch the practical course on youtube
At its core, chart analysis is about understanding price movement and market behavior. Every movement on a forex chart reflects the collective psychology of buyers and sellers. Trends, reversals, and consolidations are not random. They occur because traders are responding to fear, confidence, uncertainty, or greed. By learning forex chart analysis step by step, traders can interpret these reactions and position themselves with the market rather than against it.
The article highlights seven powerful steps that most traders get wrong. These include choosing the correct chart type, aligning timeframe with trading style, identifying trend direction, marking support and resistance, recognizing trading chart patterns, using indicators only as confirmation, and maintaining emotional discipline. Each step builds on the previous one, creating a clear framework that simplifies decision making and removes confusion.
A major theme is the importance of simplicity. Many traders overcomplicate technical analysis trading by adding multiple indicators, which often leads to conflicting signals and hesitation. The article stresses that price itself contains all the necessary information. Indicators should support analysis, not replace it. When traders strip their charts down and focus on structure and price behavior, clarity improves and confidence grows.
Emotional discipline is another key focus. Even the best chart analysis fails when traders overtrade, chase losses, or act out of fear of missing out. The article explains that consistency comes from patience, planning, and the ability to follow rules without emotional interference. By combining solid chart analysis with disciplined execution, traders significantly improve their long term results.
The summary also reinforces that chart analysis is a skill developed through practice, not instant results. Beginners often feel overwhelmed, while intermediate traders struggle with overanalysis. This guide addresses both by offering a structured approach that works across different experience levels. The goal is not to predict the market with certainty, but to identify high probability scenarios and manage risk intelligently.
In conclusion, learning how to analyze forex charts properly is the most valuable investment a trader can make. These simple but powerful steps help traders avoid common mistakes, reduce losses, and build confidence. By committing to structured chart analysis, traders move closer to consistent performance and long term success in the forex market.
Frequently asked questions
1. What is chart analysis in trading?
Chart analysis is the process of studying price movements on a chart to predict potential future market behavior. It helps traders identify trends, reversals, and trading opportunities.
2. Why is chart analysis important for traders?
Chart analysis allows traders to make informed decisions based on price behavior instead of emotions, guesses, or rumors.
3. Is chart analysis the same as technical analysis?
Chart analysis is a core part of technical analysis. Technical analysis may also include indicators, statistics, and volume studies.
4. Can beginners learn chart analysis easily?
Yes. When broken into simple steps, chart analysis for beginners becomes easy to understand and apply with practice.
5. What is the best chart type for analysis?
Candlestick charts are the most popular because they clearly show price action, momentum, and market sentiment.
6. What timeframe is best for chart analysis?
The best timeframe depends on your trading style. Higher timeframes offer stronger signals, while lower timeframes offer more trade opportunities.
7. How do I identify a trend on a chart?
A trend is identified by higher highs and higher lows for an uptrend, or lower highs and lower lows for a downtrend.
8. What is support and resistance?
Support is a price level where buying pressure appears. Resistance is a price level where selling pressure appears.
9. Why do support and resistance levels matter?
They help traders identify potential entry points, exit points, and areas where price may reverse or pause.
10. What are chart patterns?
Chart patterns are recurring price formations that suggest possible continuation or reversal of price direction.
11. Are chart patterns reliable?
They are reliable when used with proper context, confirmation, and risk management.
12. What is price action trading?
Price action trading focuses on reading raw price movement without relying heavily on indicators.
13. Do I need indicators for chart analysis?
Indicators are optional. Price alone provides valuable information, while indicators should only confirm decisions.
14. Which indicators are best for beginners?
Simple indicators like moving averages and RSI are best for beginners when used correctly.
15. How many indicators should I use on my chart?
Using one or two indicators is enough. Too many indicators cause confusion and conflicting signals.
16. What is market structure?
Market structure refers to how price moves, including trends, ranges, and breakouts.
17. How do I know when a trend is ending?
A trend may be ending when price fails to make new highs or lows and breaks key structure levels.
18. What causes traders to fail at chart analysis?
Common reasons include overtrading, emotional decisions, lack of patience, and overcomplicating charts.
19. Can chart analysis predict the market perfectly?
No. Chart analysis helps identify high probability setups, not guaranteed outcomes.
20. How long does it take to master chart analysis?
It depends on practice and discipline. Most traders see improvement within months of consistent study.
21. Is chart analysis useful in all markets?
Yes. Chart analysis works in forex, stocks, crypto, commodities, and indices.
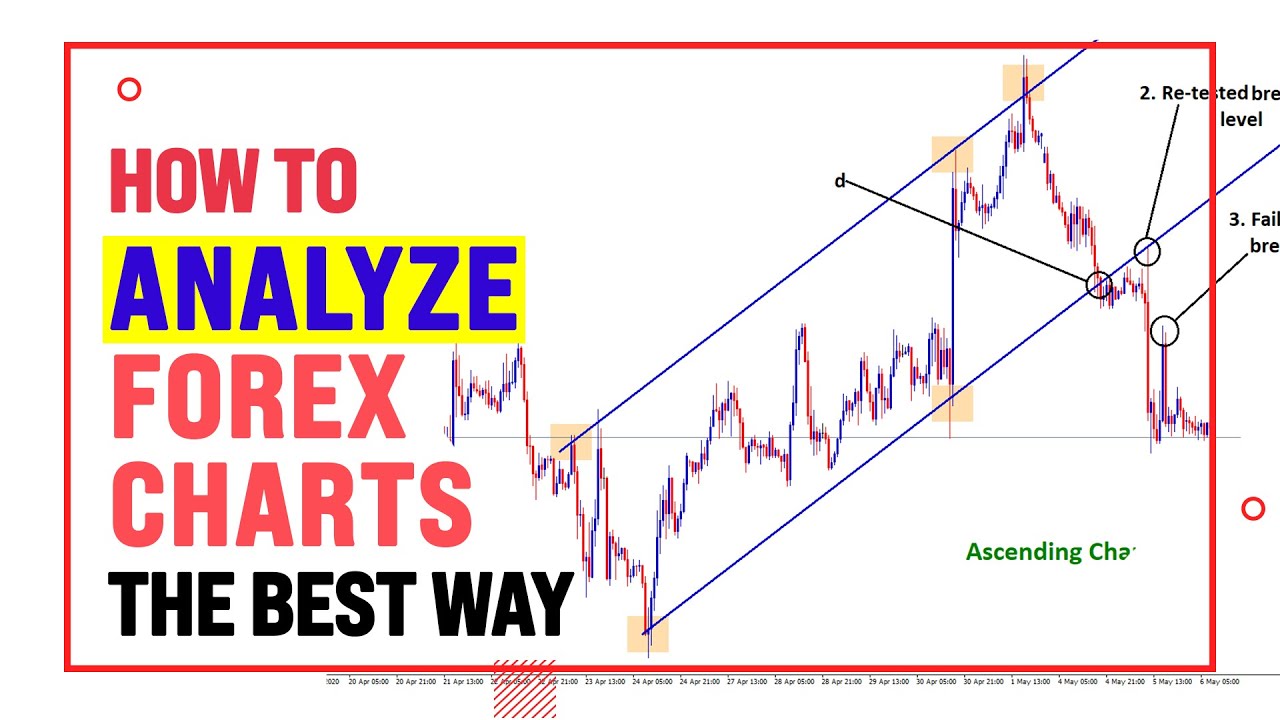
22. What is a breakout in chart analysis?
A breakout occurs when price moves strongly beyond support or resistance levels.
23. Are false breakouts common?
Yes. This is why confirmation and risk management are essential.
24. How do I avoid false signals?
Wait for confirmation, analyze higher timeframes, and avoid trading during low liquidity periods.
25. What is risk management in chart analysis?
Risk management involves controlling how much you lose per trade using stop loss and proper position sizing.
26. How much should I risk per trade?
Most professional traders risk between 1 percent and 2 percent of their trading capital per trade.
27. What is a stop loss?
A stop loss is a predefined price level where a losing trade is automatically closed.
28. What is a take profit level?
A take profit level is where a trader exits a trade to lock in profits.
29. Can chart analysis help with trade timing?
Yes. It helps traders choose better entry and exit points.
30. What is confirmation in chart analysis?
Confirmation is additional evidence that supports a trading idea, such as price reaction or indicator alignment.
31. Should I trade every chart setup I see?
No. Only trade high quality setups that align with your trading plan.
32. Why do traders overanalyze charts?
Overanalysis often comes from fear, lack of confidence, and information overload.
33. How do I keep my charts clean?
Use minimal indicators, clear support and resistance, and focus on price structure.
34. Can chart analysis reduce emotional trading?
Yes. A clear chart plan reduces impulsive and emotional decisions.
35. What is backtesting in chart analysis?
Backtesting involves applying your analysis method to past data to test its effectiveness.
36. Is chart analysis enough to be profitable?
Chart analysis combined with discipline and risk management can lead to consistent profitability.
37. Do professional traders rely on chart analysis?
Yes. Most professional traders use chart analysis as a core part of their strategy.
38. What is confluence in chart analysis?
Confluence occurs when multiple signals align at the same price level, increasing trade probability.
39. How do news events affect chart analysis?
News can cause volatility, but charts often reflect market expectations before news is released.
40. Should beginners trade during major news?
No. Beginners should avoid high volatility periods until they gain experience.
41. Can chart analysis be automated?
Yes. Many trading systems and robots are built using chart analysis rules.
42. What is the biggest mistake beginners make?
Expecting fast profits instead of focusing on learning and consistency.
43. How do I improve my chart analysis skills?
Practice daily, review past trades, and stick to one strategy at a time.
44. Is chart analysis better than fundamental analysis?
Both are useful, but chart analysis focuses on timing and price behavior.
45. Can I trade without understanding charts?
Trading without chart understanding is gambling and leads to losses.
46. How important is patience in chart analysis?
Patience is critical. Waiting for the right setup improves win rate.
47. What role does psychology play in chart analysis?
Psychology determines whether traders follow their analysis or act emotionally.
48. Can chart analysis work on small accounts?
Yes. Proper risk management makes chart analysis effective on any account size.
49. Is chart analysis still relevant in 2026 and beyond?
Yes. As long as markets exist, price behavior and human psychology remain relevant.
50. What is the first step to mastering chart analysis?
Start by learning to read price movement clearly and keep your approach simple and consistent.