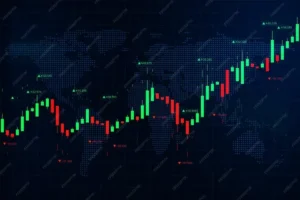
Price Action Simplified: 7 Deadly Mistakes Costing Traders $1000s (Master This Now)
Introduction: Why Price Action Trading Is Your Key to Forex Freedom (And Why You’re Probably Doing It Wrong)
Let me start with a hard truth that nobody wants to hear: If you’re struggling to make consistent profits in forex trading, your indicators are lying to you.
I know that’s a bold statement, especially if you’ve spent months (or years) learning complex indicator systems, buying expensive trading courses that promised the “holy grail” strategy, or collecting dozens of custom indicators on your MT4 platform until your charts look like a rainbow explosion.

But here’s what I discovered after losing over $8,000 in my first year of trading: The professional traders, the ones actually making six and seven figures, aren’t using the same cluttered, indicator-heavy systems that retail traders worship. They’re reading something much simpler, much more powerful, and hiding in plain sight on every single chart.
They’re reading pure price action.
Price action trading is the art of making trading decisions based solely on price movement itself, without relying on lagging indicators. It’s about understanding what the market is actually doing right now, rather than what some mathematical formula says it might do based on what happened in the past.
Think about it: Every indicator you’ve ever used—moving averages, MACD, RSI, Stochastic, Bollinger Bands—is simply a mathematical derivative of price. They’re all based on price data that has already happened. They’re inherently lagging. They show you where the market WAS, not where it’s GOING.
Price action, on the other hand, gives you the raw, unfiltered truth of market behavior. It shows you the actual battle between buyers and sellers in real-time. It reveals the psychology of thousands of traders making decisions at that exact moment.
And the best part? Price action simplified for beginners is actually easier than learning complex indicator systems. You don’t need to understand Bollinger Band calculations or MACD histogram divergences. You just need to understand what price movement means and how to interpret the story it tells.
In this comprehensive guide, I’m going to expose the 7 deadly mistakes that are costing traders thousands of dollars in losses—mistakes I made myself and watched countless others make. More importantly, I’m going to show you exactly how to fix each one and develop a best price action trading strategy that actually works.
By the time you finish reading this, you’ll understand why price action trading without indicators is the most powerful approach available to retail traders, and you’ll have a complete framework for implementing it profitably in your own trading.
But I need you to understand something critical: This knowledge alone won’t make you profitable. Knowing these mistakes isn’t enough. You must commit to eliminating them from your trading, which requires brutal honesty with yourself and the discipline to change behaviors that feel comfortable but are destroying your account.
The traders who master price action don’t do so because they’re smarter or have access to better tools. They succeed because they eliminate these seven mistakes and commit to reading the market as it actually is, not as they hope it will be.
Are you ready to finally understand what the professionals see when they look at a chart? Are you ready to strip away the noise and confusion and start trading with clarity and confidence?
The clock is ticking. Every day you continue making these mistakes is another day of losses, missed opportunities, and frustration. Every trade you take with a cluttered, indicator-based approach is a trade where you’re essentially flying blind, trusting calculations instead of reading reality.
Let’s fix that right now.
Understanding Price Action: The Foundation of Professional Trading
Before we dive into the seven deadly mistakes, we need to establish a crystal-clear understanding of what price action actually is and why it’s the foundation of all profitable trading strategies.
What Is Price Action Trading?
Price action is the movement of price over time, displayed visually on your charts through candlesticks, bars, or line charts. When we talk about forex price action trading, we’re referring to making trading decisions based exclusively on this price movement, without the crutch of lagging indicators.
Every price movement tells a story:
- When price moves up strongly: Buyers are in control, overwhelming sellers
- When price moves down aggressively: Sellers dominate, pushing through buying pressure
- When price moves sideways: Neither buyers nor sellers have control; the market is in equilibrium
- When price makes a sharp reversal: One side has exhausted their strength, and the other side is taking over
This is the language of the market. While retail traders are trying to decode indicator signals and looking for “crossovers” and “divergences,” professional price action traders are reading this language fluently, seeing opportunities that others miss entirely.
The Psychology Behind Price Action
Here’s something most trading courses won’t teach you: Price action is pure psychology made visible.
Every candle on your chart represents the emotional decisions of thousands or millions of traders. When you see a long bullish candle, you’re witnessing a period where bullish traders were so confident and aggressive that they drove prices significantly higher, overwhelming any sellers trying to push back.
When you see a doji (where open and close are nearly identical), you’re observing indecision—a moment where bulls and bears fought to a stalemate, with neither side able to gain control.
Understanding this psychological component is what separates amateur price action traders from professionals. Amateurs memorize patterns. Professionals understand the emotions and decisions those patterns represent, which allows them to anticipate what’s likely to happen next.
Why Price Action Works When Indicators Fail
Indicators fail for a fundamental reason: They’re backward-looking mathematical formulas applied to a forward-looking, dynamic market.
Consider a moving average. By definition, it’s showing you the average price over the past X periods. When price is moving strongly in one direction, the moving average will always lag behind, giving you signals after the best part of the move is already over.
The RSI tells you when something is “overbought” or “oversold,” but strong trends regularly stay overbought or oversold for extended periods. How many times have you shorted because RSI was above 70, only to watch price continue rallying for hundreds of pips?
Price action, by contrast, shows you what’s happening right now. It doesn’t need to calculate anything or wait for confirmation. The information is immediate and accurate because it’s the source data from which all indicators are derived.
Think of it this way: Would you rather get your news directly from the source, or would you prefer to hear it through several layers of interpretation and delay? Price action is the source. Indicators are the filtered, delayed interpretation.

The Three Core Components of Price Action Analysis
Successful price action strategy is built on three foundational elements:
1. Support and Resistance Levels
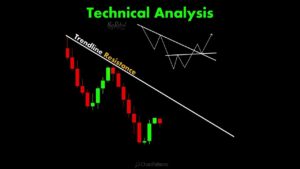
These are price levels where the market has historically shown significant buying or selling pressure. Support is where buyers have consistently entered to prevent further declines. Resistance is where sellers have consistently appeared to prevent further advances.
Price action traders use these levels as decision points. When price approaches a major support level and shows bullish rejection patterns, that’s a high-probability buying opportunity. When price reaches resistance and shows bearish rejection, it’s time to consider selling.
2. Market Structure
This refers to the overall pattern of higher highs and higher lows (uptrend), lower highs and lower lows (downtrend), or equal highs and lows (range). Understanding market structure tells you the context in which you’re trading.
A bullish candlestick pattern in a downtrend has a very different meaning than the same pattern in an uptrend. Context is everything in price action trading.
3. Candlestick Patterns
These are specific formations created by one or more candles that indicate potential reversals or continuations. Patterns like engulfing candles, pin bars, inside bars, and dojis all tell specific stories about the battle between buyers and sellers.
The key difference between how professionals and amateurs use these patterns is context. Professionals only trade patterns that appear at significant levels within favorable market structure. Amateurs trade every pattern they see, regardless of location or context.
Why Most Traders Fail at Price Action (The Preview)
Here’s the uncomfortable reality: Most traders who try to trade price action still lose money. Not because price action doesn’t work—it absolutely does—but because they make critical mistakes that sabotage their results.
These mistakes are subtle. They’re the kind of errors that seem reasonable in the moment but are systematically destroying profitability over time. Some of these mistakes I’m about to share cost me over $5,000 before I even recognized I was making them.
The seven deadly mistakes we’re about to explore aren’t just theoretical problems. They’re real, specific errors that I see beginners and intermediate traders making every single day. I made them myself. I’ve watched friends and fellow traders make them. And I’ve seen how eliminating these mistakes transforms struggling traders into consistently profitable ones.
Let’s identify these account killers so you can eliminate them from your trading forever.
Deadly Mistake #1: Trading Price Action Without Understanding Market Structure
This is the number one reason price action traders fail, and it’s so fundamental that everything else in this article depends on getting this right.
What Is Market Structure and Why Does It Matter?
Market structure is the framework within which all price action occurs. It’s the difference between random price movement and organized, directional trends. When traders talk about how to trade price action profitably, understanding market structure is the foundation of that profitability.
The Three Market Structures:
1. Uptrend Structure:
- Price makes higher highs and higher lows
- Each rally takes price to a new high
- Each pullback stops above the previous low
- Buyers are in overall control
2. Downtrend Structure:
- Price makes lower highs and lower lows
- Each decline takes price to a new low
- Each rally stops below the previous high
- Sellers are in overall control
3. Range/Consolidation Structure:
- Price makes relatively equal highs and lows
- No clear directional bias
- Price oscillates between defined support and resistance
- Neither buyers nor sellers have control
The Deadly Mistake: Ignoring Structure When Trading Patterns
Here’s how this mistake plays out in real trading:
You see a beautiful bullish engulfing pattern on the 4-hour EUR/USD chart. It looks textbook perfect—a small bearish candle followed by a large bullish candle that completely engulfs it. You’ve studied candlestick patterns. You know this is a bullish signal. So you buy.
The market then drops 80 pips and stops you out.
What went wrong?
You ignored market structure. That bullish engulfing pattern appeared in the middle of a strong downtrend, right into a resistance level. The overall structure was bearish (lower highs and lower lows). That single bullish pattern was just a temporary pullback in a dominant downtrend—noise within the larger structure.
Professional price action traders wouldn’t have taken that trade. They would have recognized that trading against the structure is low probability, regardless of how perfect the individual pattern looks.
How I Lost $1,200 Learning This Lesson
In my second month of trading, I was obsessed with pin bar patterns. I had read that pin bars at key levels were high-probability setups, and I was determined to trade every one I saw.
GBP/USD was in a strong downtrend, making lower lows and lower highs for three consecutive weeks. Then I spotted a bullish pin bar on the daily chart. Long lower wick, small body—looked perfect.
I completely ignored the obvious downtrend structure. I ignored that price was making clear lower highs and lower lows. I saw the pattern I wanted to see and entered long at 1.3850 with a 60-pip stop.
Over the next four days, the downtrend continued, and I was stopped out. That single trade cost me $1,200. But the real lesson was worth far more than $1,200.
The lesson: Market structure always wins. Individual patterns matter only when they align with structure.
The Solution: The Structure-First Approach to Price Action
Here’s how to trade price action correctly by prioritizing structure:
Step 1: Identify the Overall Structure First
Before you even look for patterns, determine what structure you’re in:
- Zoom out to the daily or weekly chart
- Identify the trend: Are we making higher highs and higher lows? Lower highs and lower lows? Or equal swings?
- Mark the most recent swing highs and lows
- Determine whether the market is trending or ranging
Step 2: Trade in Harmony with Structure
- In uptrends: Only look for bullish patterns at support levels or during pullbacks
- In downtrends: Only look for bearish patterns at resistance levels or during rallies
- In ranges: Look for reversals at the boundaries (support and resistance) of the range
Step 3: Wait for Structure Breaks
If you want to trade a trend reversal (counter to the current structure), you must wait for a confirmed structure break:
- For downtrend-to-uptrend: Wait for price to break above a previous lower high, then make a higher low
- For uptrend-to-downtrend: Wait for price to break below a previous higher low, then make a lower high
Don’t anticipate structure changes. Wait for confirmation.
Practical Example: Trading with Structure
Scenario: USD/JPY daily chart shows a clear uptrend. Price has made higher highs and higher lows for the past month, rallying from 108.50 to 111.50.
Price pulls back to the 110.00 level (a previous swing high that should now act as support). A bullish pin bar forms exactly at this level, showing rejection of lower prices.
Structure Analysis:
- ✓ Uptrend intact (higher highs and higher lows)
- ✓ Pullback to logical support level
- ✓ Bullish pattern at support in context of uptrend
- ✓ This is WITH structure, not against it
Trade Decision: This is a high-probability long setup because the pattern aligns with structure.
Contrast this with:
Same USD/JPY pair, but now we’re in a clear downtrend (lower highs and lower lows). That same bullish pin bar appears, but this time at a resistance level in the middle of the downtrend.
Structure Analysis:
- ✗ Downtrend in place (lower highs and lower lows)
- ✗ Pin bar at resistance, not support
- ✗ Pattern is counter to the prevailing structure
Trade Decision: Skip this setup. The pattern fights the structure, dramatically reducing probability of success.
Key Takeaways: Eliminating Mistake #1
- Always identify market structure before looking for patterns
- Trade WITH structure, not against it (until structure definitively breaks)
- A perfect pattern in the wrong structure is still a bad trade
- Structure provides the context that determines whether a pattern is high or low probability
- Most losing trades come from trading patterns that contradict structure
Master this concept, and you’ll immediately eliminate 30-40% of losing trades from your results. Market structure is the filter that separates professional price action traders from amateurs who chase every pattern they see.

Deadly Mistake 2: Overcomplicating Price Action with Unnecessary Indicators
This might seem contradictory in an article about price action trading without indicators, but the reality is that most traders who claim to trade “price action” still can’t let go of their indicators completely.
The Indicator Addiction: Why Traders Can’t Let Go
There’s a psychological comfort in indicators. They give you something to “analyze.” They make you feel like you’re doing sophisticated technical analysis. They provide clear, numerical signals that feel objective and scientific.
But here’s the truth: Every indicator you add to a pure price action chart reduces your edge.
Let me explain why this happens and why it’s costing you money.
How Indicators Sabotage Price Action Trading
Problem 1: Conflicting Signals Create Paralysis
You’re watching a beautiful bullish engulfing pattern form at a major support level. Every price action signal says “buy.” But then you glance at your RSI, and it’s at 65. Not quite overbought, but getting there. Your MACD is showing some bearish divergence. One moving average says buy, but another hasn’t confirmed yet.
Now you’re confused. The pure price action signal was clear, but your indicators are creating doubt and hesitation. So you either don’t take the trade (missing a winner) or you take it with less confidence, causing you to exit prematurely.
Problem 2: Lagging Signals Cause Late Entries
Price action gives you entry signals in real-time. A pin bar rejection at support happens NOW. The information is immediate.
But if you’re waiting for indicator confirmation, waiting for MACD to cross, or RSI to reach a certain level, or for price to close above a moving average, you’re entering late. The best part of the move is already over, giving you a worse risk-to-reward ratio and lower probability of success.
Problem 3: Visual Clutter Prevents Clear Thinking
When your chart has 3-4 indicators, multiple moving averages, and perhaps some custom oscillators, your brain has to process all this information simultaneously. This cognitive load makes it harder to see what actually matters: pure price movement.
I remember my charts in my first year of trading. I had a 20 EMA, 50 EMA, 200 EMA, RSI, MACD, Stochastic, ATR, and Bollinger Bands all on one chart. I thought I looked professional. In reality, I couldn’t see the forest for the trees.
My $2,300 Lesson in Indicator Overload
In month four of my trading journey, I was convinced I had found the “perfect” system: Price action confirmation plus RSI and MACD alignment.
EUR/USD formed a bearish engulfing pattern right at 1.1800 resistance. Clear rejection. Strong bearish candle. Everything about the price action screamed “short this.”
But I waited for indicator confirmation. RSI was at 68—close to overbought but not quite there yet. MACD was positive but showing signs of turning. So I waited.
Price dropped 40 pips while I watched, waiting for my indicators to “confirm.” When they finally aligned, I entered short at 1.1760. The move was mostly over. Price dropped another 30 pips to 1.1730, then reversed sharply, stopping me out at 1.1780 for a 20-pip loss.
Had I simply trusted the price action and entered at 1.1800 with a 30-pip stop, I would have captured a 70-pip winner with a perfect 2.3:1 risk-reward ratio.
Instead, my indicator obsession caused me to enter late, miss most of the move, and take a loss. Over the next three weeks, this pattern repeated five more times, costing me approximately $2,300 in missed profits and actual losses.
That’s when I made a radical decision: I removed every indicator from my charts except for a single 200-period moving average (and I only kept that to help identify long-term trend direction at a glance).
My trading transformed almost immediately. My win rate increased. My entries improved. My confidence grew because I was no longer dealing with conflicting information.
The Solution: Strip Your Charts to Pure Price Action
Here’s your action plan to eliminate this deadly mistake:
Step 1: Remove 90% of Your Indicators
Go through your charts right now and remove everything except price itself. Yes, this will feel uncomfortable at first. You’ve been depending on these indicators as a security blanket. But that security is false.
What to Keep:
- Price candlesticks (obviously)
- Support and resistance levels (horizontal lines you draw)
- Optionally: A single moving average (200 EMA) for long-term trend reference only
What to Remove:
- Multiple moving averages
- RSI, Stochastic, MACD, and other oscillators
- Bollinger Bands, Keltner Channels, and envelope indicators
- Volume indicators (unless you’re trading stocks where volume is reliable)
- Any custom indicators
- Trendlines (these are fine, but many traders draw too many and clutter their charts)
Step 2: Learn to Trust Pure Price Action Signals
This requires a mindset shift. You need to believe that price itself contains all the information you need. Because it does.
Start by reviewing historical charts with only price candlesticks visible. Study past major moves and ask yourself: “Can I see what happened here just by looking at price action?” The answer will always be yes.
Major reversals are obvious when you look at pure price action. Trend continuations are clear. Support and resistance breaks are unmistakable. You don’t need indicators to see any of this.
Step 3: If You Must Use an Indicator, Use It Correctly
If you absolutely cannot trade without some indicator reference, follow these rules:
Rule 1: Maximum of ONE indicator, and it must serve a specific, non-redundant purpose
Rule 2: The indicator provides context only—never use it as your primary entry signal
Rule 3: If price action and your indicator conflict, always trust price action
Example of Proper Indicator Use: You keep the 200 EMA on your chart solely to quickly identify whether you’re above or below the long-term average. If price is above the 200 EMA, you bias toward long trades. Below it, you bias toward shorts. But the actual entry signal still comes purely from price action patterns at key levels.
Real-World Example: Comparing Indicator vs. Pure Price Action
Setup: GBP/USD on 4-hour chart
Indicator-Heavy Approach:
- Trader sees price approaching support at 1.2500
- Waits for RSI to drop below 30 (oversold)
- Waits for MACD to show bullish divergence
- Waits for price to close above 20 EMA
- Finally enters at 1.2545, three candles after the initial bounce
- Stop at 1.2475 (70 pips), target at 1.2615 (70 pips)
- Risk-to-reward: 1:1
Pure Price Action Approach:
- Trader sees price approaching support at 1.2500
- A bullish pin bar forms at 1.2505, showing strong rejection
- Enters immediately at 1.2515 when next candle opens bullish
- Stop at 1.2480 (35 pips), target at 1.2615 (100 pips)
- Risk-to-reward: 1:2.85
Result: Price rallies to 1.2610 over the next 12 hours.
The indicator trader makes 65 pips with a 70-pip risk (barely 1:1). The price action trader makes 95 pips with a 35-pip risk (nearly 3:1).
Same market move. Dramatically different results. The price action trader entered earlier, at better prices, with better risk-to-reward—all because they weren’t waiting for lagging indicator confirmation.
Key Takeaways: Eliminating Mistake 2
- Indicators add lag, conflicting signals, and visual clutter—all of which reduce your edge
- Price action gives you immediate, accurate information that indicators derive from and delay
- If you can’t trust price action alone, you don’t understand price action well enough yet
- The best price action trading strategy uses minimal or zero indicators
- Your edge comes from reading what the market IS doing, not what indicators say it MIGHT do
Strip your charts down to pure price. Yes, it will feel naked and uncomfortable at first. But within 2-3 weeks, you’ll wonder how you ever traded with all that clutter. Your decision-making will become clearer, faster, and more profitable.
Deadly Mistake 3: Ignoring Risk-to-Reward Ratio in Price Action Setups
This mistake is particularly insidious because traders make it even when they correctly identify high-probability price action setups. You can nail the entry, understand the structure perfectly, trade without indicator confusion—and still lose money if you ignore risk-to-reward ratios.
What Is Risk-to-Reward and Why It Determines Your Success
Risk-to-reward ratio (R:R) is simply the relationship between how much you’re risking on a trade versus how much you stand to gain.
- Risk $100 to make $200 = 1:2 risk-to-reward
- Risk $100 to make $300 = 1:3 risk-to-reward
- Risk $100 to make $100 = 1:1 risk-to-reward
Here’s the mathematical reality that most traders don’t grasp: With proper risk-to-reward ratios, you can be wrong more often than you’re right and still be profitable.
Example:
- Win rate: 40% (you’re wrong 60% of the time)
- Average risk: $100 per trade
- Average reward: $300 per trade (3:1 R:R)
- Over 10 trades: 4 winners × $300 = $1,200 profit; 6 losers × $100 = $600 loss
- Net result: $600 profit despite being wrong 60% of the time
Now compare this to poor risk-to-reward:
- Win rate: 60% (better win rate!)
- Average risk: $100 per trade
- Average reward: $100 per trade (1:1 R:R)
- Over 10 trades: 6 winners × $100 = $600 profit; 4 losers × $100 = $400 loss
- Net result: $200 profit despite being right 60% of the time
The trader with the worse win rate made 3x more money because of better risk-to-reward management.
The Deadly Mistake: Taking Setups with Poor Risk-to-Reward
Most traders, especially those new to price action simplified for beginners, make this mistake constantly:
They identify a valid price action setup—let’s say a bullish pin bar at support. But they don’t properly measure the risk-to-reward before entering. They place their stop loss somewhat arbitrarily (maybe 50 pips), and they take profit “when it looks like enough” (maybe 60 pips).
That’s roughly 1:1.2 risk-to-reward. To profit consistently with this approach, they would need to win more than 50% of their trades. And with typical slippage, spreads, and commissions, they probably need to win 55-60% just to break even.
That’s incredibly difficult. Even professional traders rarely achieve 60%+ win rates consistently.
How This Mistake Cost Me $3,400
During months 3-5 of my trading journey, I was actually getting pretty good at identifying price action setups. I could spot pin bars, engulfing patterns, and inside bar breakouts. My entry timing was decent.
But I was still losing money. In fact, my account dropped from $12,000 to $8,600 during this period—a $3,400 loss.
I couldn’t understand it. I was “right” about market direction more than half the time. My win rate over those three months was approximately 58%. So why was I losing money?
When I finally did a thorough review of my trading journal, the problem became painfully obvious: My average winner was 45 pips. My average loser was 52 pips.
I was winning more often, but losing more on my losses than I was gaining on my wins. My risk-to-reward ratio was inverted—approximately 1.15:1 (risking 52 to make 45).
The math was simple and brutal:
- 58 wins × 45 pips = 2,610 pips gained
- 42 losses × 52 pips = 2,184 pips lost
- Net: 426 pips profit on 100 trades
That seems positive until you account for spreads (average 2 pips × 100 trades = 200 pips) and the fact that my losing trades often slipped a few pips past my stop, while my winning trades sometimes closed slightly before my target.
After these factors, my “positive” 426 pips became closer to 180 pips across 100 trades. With the position sizes I was using, that translated to the $3,400 account loss.
The revelation: I didn’t have a strategy problem or a pattern recognition problem. I had a risk-to-reward problem.
The Solution: The 2:1 Minimum Rule
Here’s how to fix this account-killing mistake:
Rule #1: Never Enter a Trade with Less Than 2:1 Risk-to-Reward
Before you click that buy or sell button, you must measure:
- Exactly where your stop loss will be
- Exactly where your take profit target is
- The ratio between these two
If the ratio is worse than 2:1 (risking 50 to make less than 100), don’t take the trade. Period. No exceptions. No “but this one looks really good” justifications.
Rule #2: Let Market Structure Determine Your Targets
Don’t pick arbitrary take profit levels. Let the chart tell you where price is likely to go:
- In an uptrend: Target the next resistance level or previous swing high
- In a downtrend: Target the next support level or previous swing low
- In a range: Target the opposite boundary of the range
This approach ensures your targets are logical and achievable based on market structure.
Rule #3: Use Tight, Logical Stop Losses
Your stop loss should be placed in a location that, if hit, invalidates your trade thesis:
- For a bullish setup at support: Place your stop below the support level (if price goes below support, the setup is wrong)
- For a bearish setup at resistance: Place your stop above the resistance level
- For pattern-based entries: Place your stop beyond the pattern’s extreme (beyond the pin bar tail, or beyond the engulfing candle’s high/low)
The goal is to use the tightest stop loss that still gives your trade room to work, placed at a level where you definitively know you’re wrong if hit.
Practical Examples: Good vs. Bad Risk-to-Reward in Price Action Trading
Bad Example:
- Setup: Bullish engulfing at support (1.3500)
- Entry: 1.3510
- Stop loss: 1.3450 (60 pips)
- Take profit: 1.3570 (60 pips)
- Risk-to-reward: 1:1
- Assessment: Poor. Requires 50%+ win rate to profit. Not acceptable.
Good Example:
- Setup: Same bullish engulfing at support (1.3500)
- Entry: 1.3510
- Stop loss: 1.3480 (30 pips—just below the engulfing candle low and support zone)
- Take profit: 1.3630 (120 pips—next resistance level based on market structure)
- Risk-to-reward: 1:4
- Assessment: Excellent. Can be wrong 75% of the time and still profit.
Notice that the stop loss in the good example is tighter because it’s placed precisely below the pattern and support, not arbitrarily far away. The target is farther because it’s based on actual market structure (next resistance) rather than an arbitrary pip count.
The Psychological Battle: Why Traders Struggle with This
Taking trades with proper risk-to-reward requires you to accept two uncomfortable truths:
Truth 1: Most trades won’t reach your target.
When you’re targeting 2:1 or 3:1 risk-to-reward, you’re aiming for significant moves. Price won’t always cooperate. You’ll have many trades that move partially in your favor, then reverse and stop you out.
This is psychologically difficult. You’ll watch a trade go 60% toward your 2:1 target, then reverse, and you’ll think “I should have taken profits!” But if you start exiting early every time you see some profit, you’ll destroy your risk-to-reward ratio and end up back in the losing cycle.
Truth 2: You need to let winners run and cut losers quickly.
This is the opposite of human psychology. Humans naturally want to take profits quickly (fear of losing them) and hold onto losses (hope they’ll recover). Professional trading requires doing exactly the opposite.
When you have a winner moving toward your 2:1 or 3:1 target, you must resist the urge to take profits early. When you have a loser approaching your stop, you must let it get stopped out without moving the stop further away.
Advanced Technique: Scaling Out While Maintaining Risk-to-Reward
If the psychological pressure of holding for full targets is too much, here’s a compromise that still maintains positive expectancy:
The 50% Rule:
- Close 50% of your position at 2:1 risk-to-reward
- Let the remaining 50% run to 3:1 or 4:1 risk-to-reward
- Move your stop to breakeven after you close the first half
Example:
- Risk: 30 pips
- Close half at 60 pips (2:1)
- Let other half run to 120 pips (4:1)
- If the second half gets stopped at breakeven, you still made 30 pips on the first half
- If both targets hit, you average 90 pips gained (60 + 120 / 2), giving you an overall 3:1 risk-to-reward
This approach gives you the psychological relief of “banking” some profit while still giving you the chance to capture larger moves when they occur.
Key Takeaways: Eliminating Mistake 3
- Risk-to-reward ratio is more important than win rate for long-term profitability
- Never take a price action setup with less than 2:1 risk-to-reward (preferably 3:1)
- Let market structure determine your targets, not arbitrary pip counts
- Place stops at logical invalidation points, not arbitrary distances
- Accept that most trades won’t hit your full target—this is normal and okay
- The math works in your favor when you maintain proper risk-to-reward across many trades
Fix this mistake, and you can literally transform from blowing account.
Summary
Price action trading is presented as the most direct and reliable path to long term profitability in forex, yet most traders struggle with it because they approach it the wrong way. The core argument is simple. Indicators are not helping struggling traders because they are derived from past price data and therefore lag behind real market movement. By relying on them, traders end up reacting late, missing high quality entries, and making decisions based on delayed information rather than what the market is doing in real time.
Price action focuses purely on price movement itself. It studies how buyers and sellers interact on the chart through candles, highs and lows, trends, and key levels. Every candle reflects trader psychology. Strong bullish candles show aggressive buying. Sharp bearish moves show selling pressure. Indecision candles reveal balance and uncertainty. When traders learn to read these movements, they stop guessing and start understanding the market’s story as it unfolds.
The foundation of professional price action trading rests on three pillars. The first is support and resistance. These are levels where price has historically reacted due to strong buying or selling interest. The second is market structure. This defines whether the market is trending up, trending down, or ranging. Structure provides context and determines whether buying or selling makes sense. The third is candlestick patterns, which signal potential reversals or continuations. These patterns only work when they appear at the right levels and in the right structure.
A major reason traders fail is ignoring market structure. Many traders take bullish patterns in downtrends or bearish patterns in uptrends, not realizing that structure always overrides individual signals. A perfect pattern in the wrong context is still a low probability trade. Professionals always identify structure first, then look for price action setups that align with it.
Another critical mistake is overloading charts with indicators. Indicators create conflicting signals, delay entries, and clutter charts, which clouds judgment. Pure price action offers immediate and clearer information. When traders strip their charts down to price, support and resistance, and minimal tools, decision making improves dramatically.
Risk to reward is another decisive factor. Even with accurate entries, traders lose money when they risk too much for too little gain. Maintaining a minimum of two to one risk to reward allows traders to be profitable even with a lower win rate. Proper stop placement and realistic targets based on structure are essential to long term success.
The message is clear. Price action works, but only for traders willing to simplify, respect structure, manage risk properly, and abandon habits that feel comfortable but destroy accounts. Mastery comes from discipline, honesty, and commitment to reading the market as it truly is.